.svg)


Most partner teams can tell you how many partners completed training last quarter. Far fewer can tell you whether that training led to a single closed deal.
That gap between enablement activity and revenue impact is where partner programs lose credibility with leadership. The right KPIs for measuring partner enablement program success bridge it by connecting what partners learn and use to what they actually sell.
Below are eight partner enablement KPIs that tie training, content adoption, and portal engagement to partner-sourced revenue — plus practical ways to track them inside your CRM so you can defend budget, scale what works, and cut what doesn’t.
Why partner enablement KPIs matter for revenue growth
Partner enablement refers to the training, content, and resources you provide so partners can sell your product effectively. In practice, the KPIs for measuring partner enablement program success should cover three areas:
- Engagement (Are partners actually showing up and using what you provide?)
- Readiness (Do they understand your positioning well enough to sell?)
- Revenue outcomes (Is any of this translating to pipeline and closed-won deals?)
The reason most teams struggle to prove ROI is simple: enablement data lives in disconnected systems. Training completions sit in an LMS. Deal activity lives in the CRM. Content views and downloads live in a portal or file-sharing tool. When leadership asks, “What did we get for this?” you’re stuck stitching together screenshots and spreadsheets.
When you connect enablement effort to closed revenue, you stop guessing. You can see which onboarding steps correlate with partners reaching their first deal, which training tracks shorten the sales cycle, and which content assets show up in deals that actually close.
Partner enablement KPIs vs. channel partner performance metrics
Before you pick metrics, be clear on what you’re measuring. A lot of partner programs fail because they report only “readiness” metrics (like training completion) without tying them to performance (like revenue).
Think of enablement KPIs as leading indicators. If training completion drops, you’ll often see deal velocity slow a quarter later. If content adoption spikes after a product launch, pipeline usually follows.
The goal is to track both categories side by side so you can answer the questions founders and execs actually care about:
- Do certified partners close bigger deals?
- Which onboarding steps predict first-deal success?
- Where are partners getting stuck — and what’s the revenue impact?
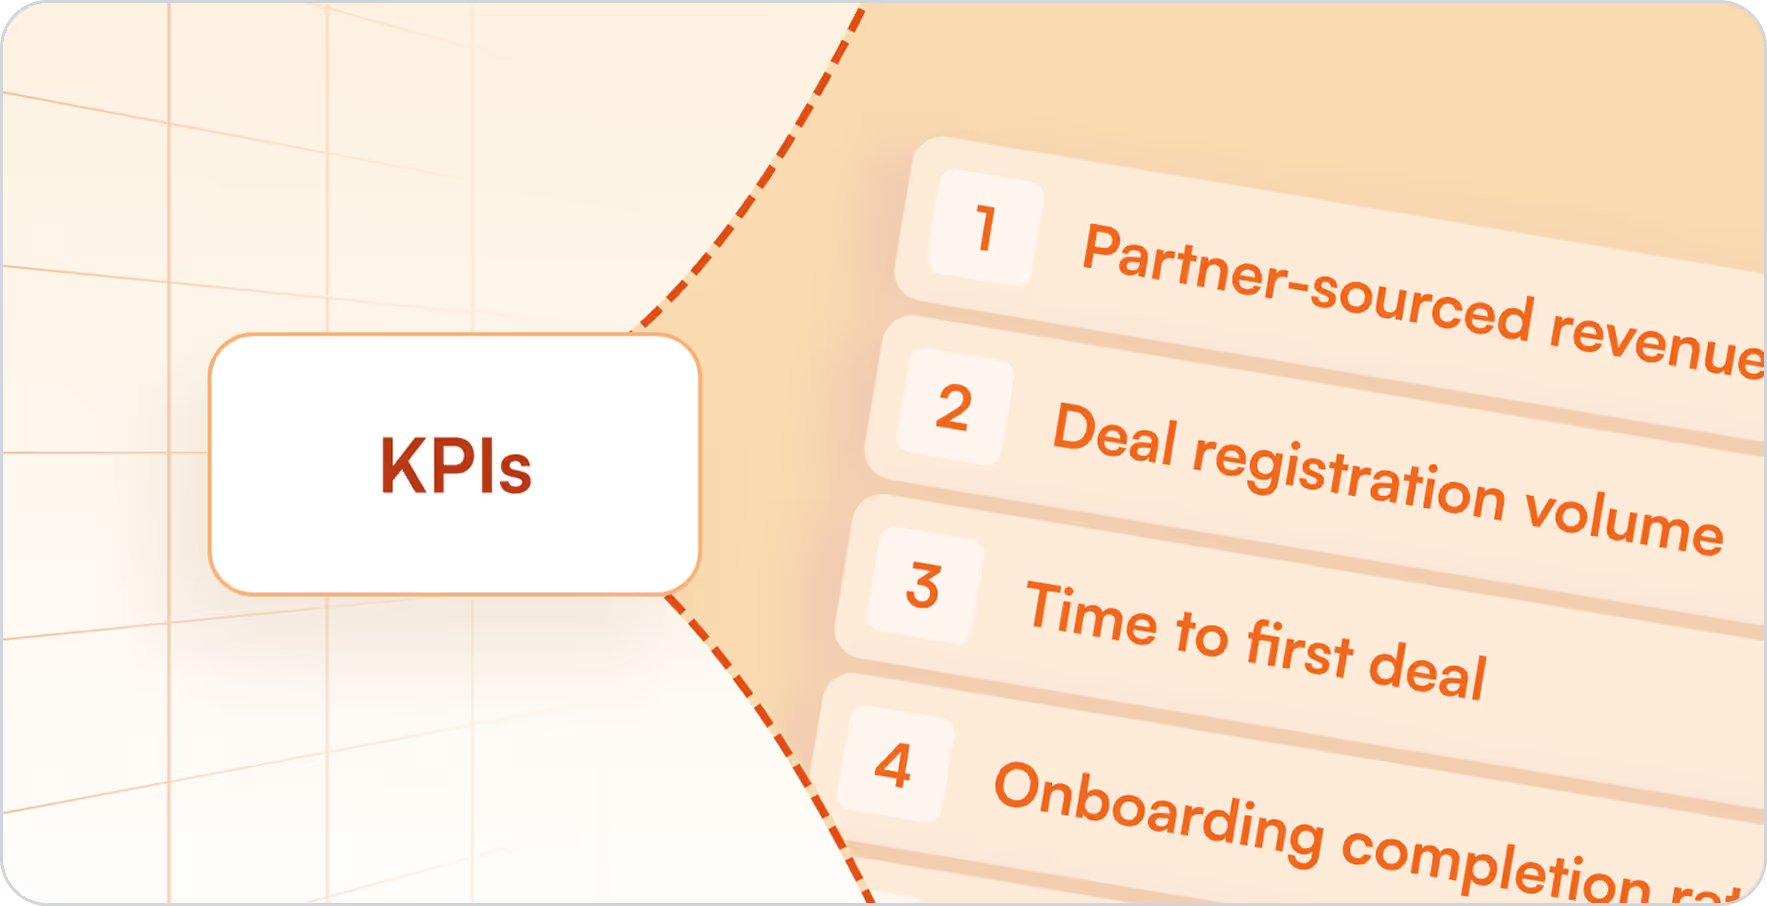
Eight KPIs for measuring partner enablement program success (the ones that actually map to revenue)
Each KPI below is designed to connect enablement investment to outcomes. If a metric can’t influence a decision (what to fix, what to double down on, what to stop), it doesn’t belong on your dashboard.
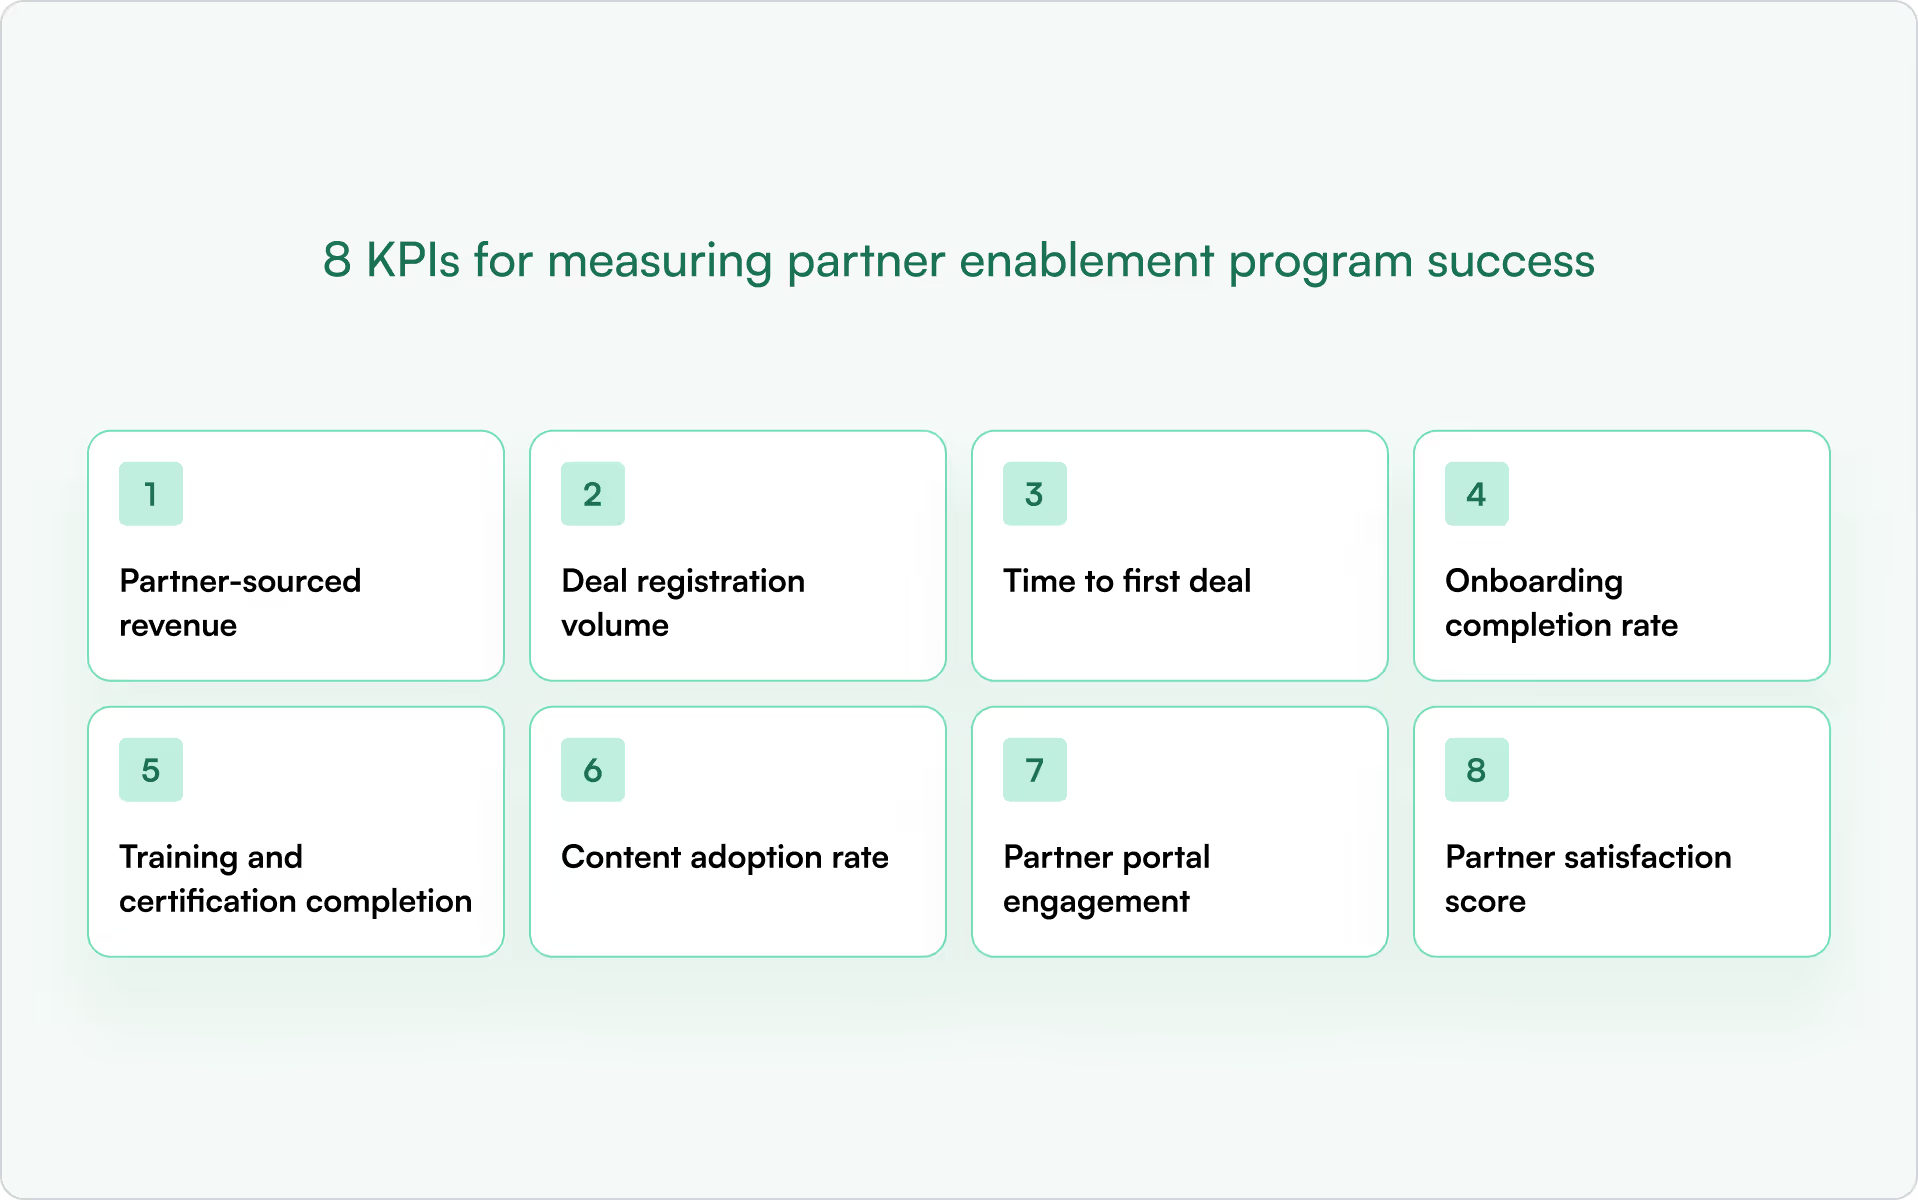
1) Partner-sourced revenue
Partner-sourced revenue is the total revenue from deals your partners originated and closed. This is the cleanest proof that enablement isn’t just “busywork.”
Why it matters: It validates that partner training, content, and support translate into closed-won results — not just activity.
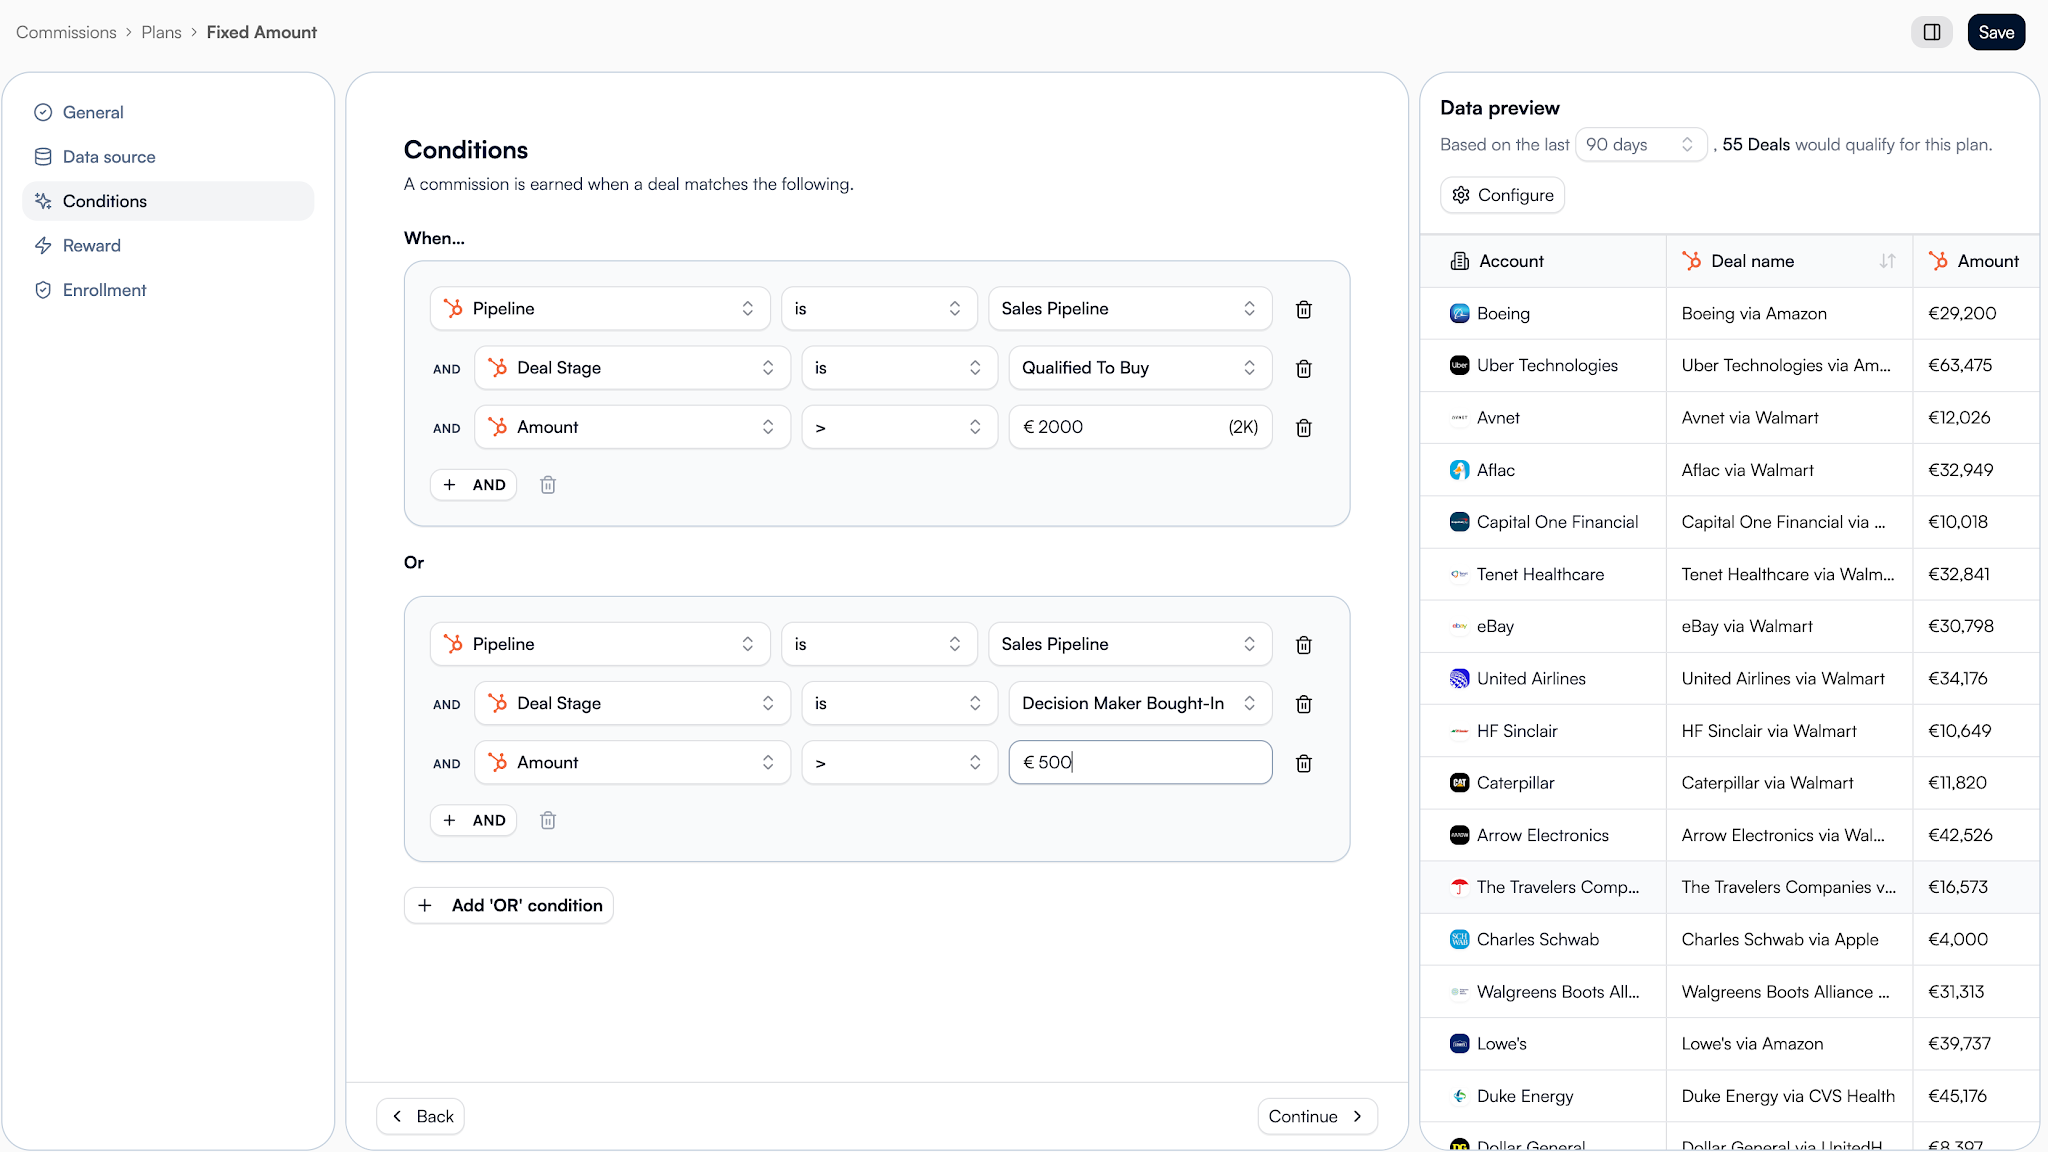
How to track it: To measure it, tag deals with a partner source field in HubSpot or Salesforce. Segment by partner tier, region, or motion to see where enablement is working and where it isn’t.
2) Deal registration volume
Deal registration volume is the number of deals partners register over a given period. It’s a strong signal of partner confidence and program clarity.
Why it matters: Enabled partners who understand your positioning and process tend to register more deals — and earlier in their sales motion.
How to track it: Track registrations per partner and segment by tier, region, or partner manager. A sudden drop in registrations from a previously active partner often indicates friction in your enablement or deal reg process, potentially signaling channel conflict.
3) Time to first deal
Time to first deal measures the days from partner onboarding completion to their first closed-won deal. If you want a single KPI that reflects “partner ramp speed,” it’s this one.
Why it matters: A long ramp time usually means your onboarding is too theoretical, too long, or missing the real-world steps partners need to sell.
How to track it: Store an onboarding completion date on the partner record, then compare it to the first closed-won date on partner-associated opportunities. Track median time (not just average) to avoid outliers distorting the story.
4) Onboarding completion rate
Onboarding completion rate is the percentage of new partners who finish your onboarding program. Low completion is rarely a “partner problem” — it’s typically a relevance or friction problem.
Why it matters: If partners don’t complete onboarding, they won’t know how to position, qualify, register, or co-sell — and your pipeline will show it later.
How to track it: Track completion status per partner and identify where drop-off occurs. If most partners abandon onboarding at the same step, that step is the bottleneck — rewrite it, shorten it, or make it more hands-on.
5) Training and certification completion
Training and certification completion measures the percentage of partners who complete required training or earn certifications. In many programs, certification is the “permission to sell” signal.
Why it matters: Certified partners tend to position more accurately, handle objections better, and require less support per deal.
How to track it: Sync LMS or training platform data to partner records in your CRM. That connection lets you correlate certification status with win rate, cycle length, and average deal size — not just completions.
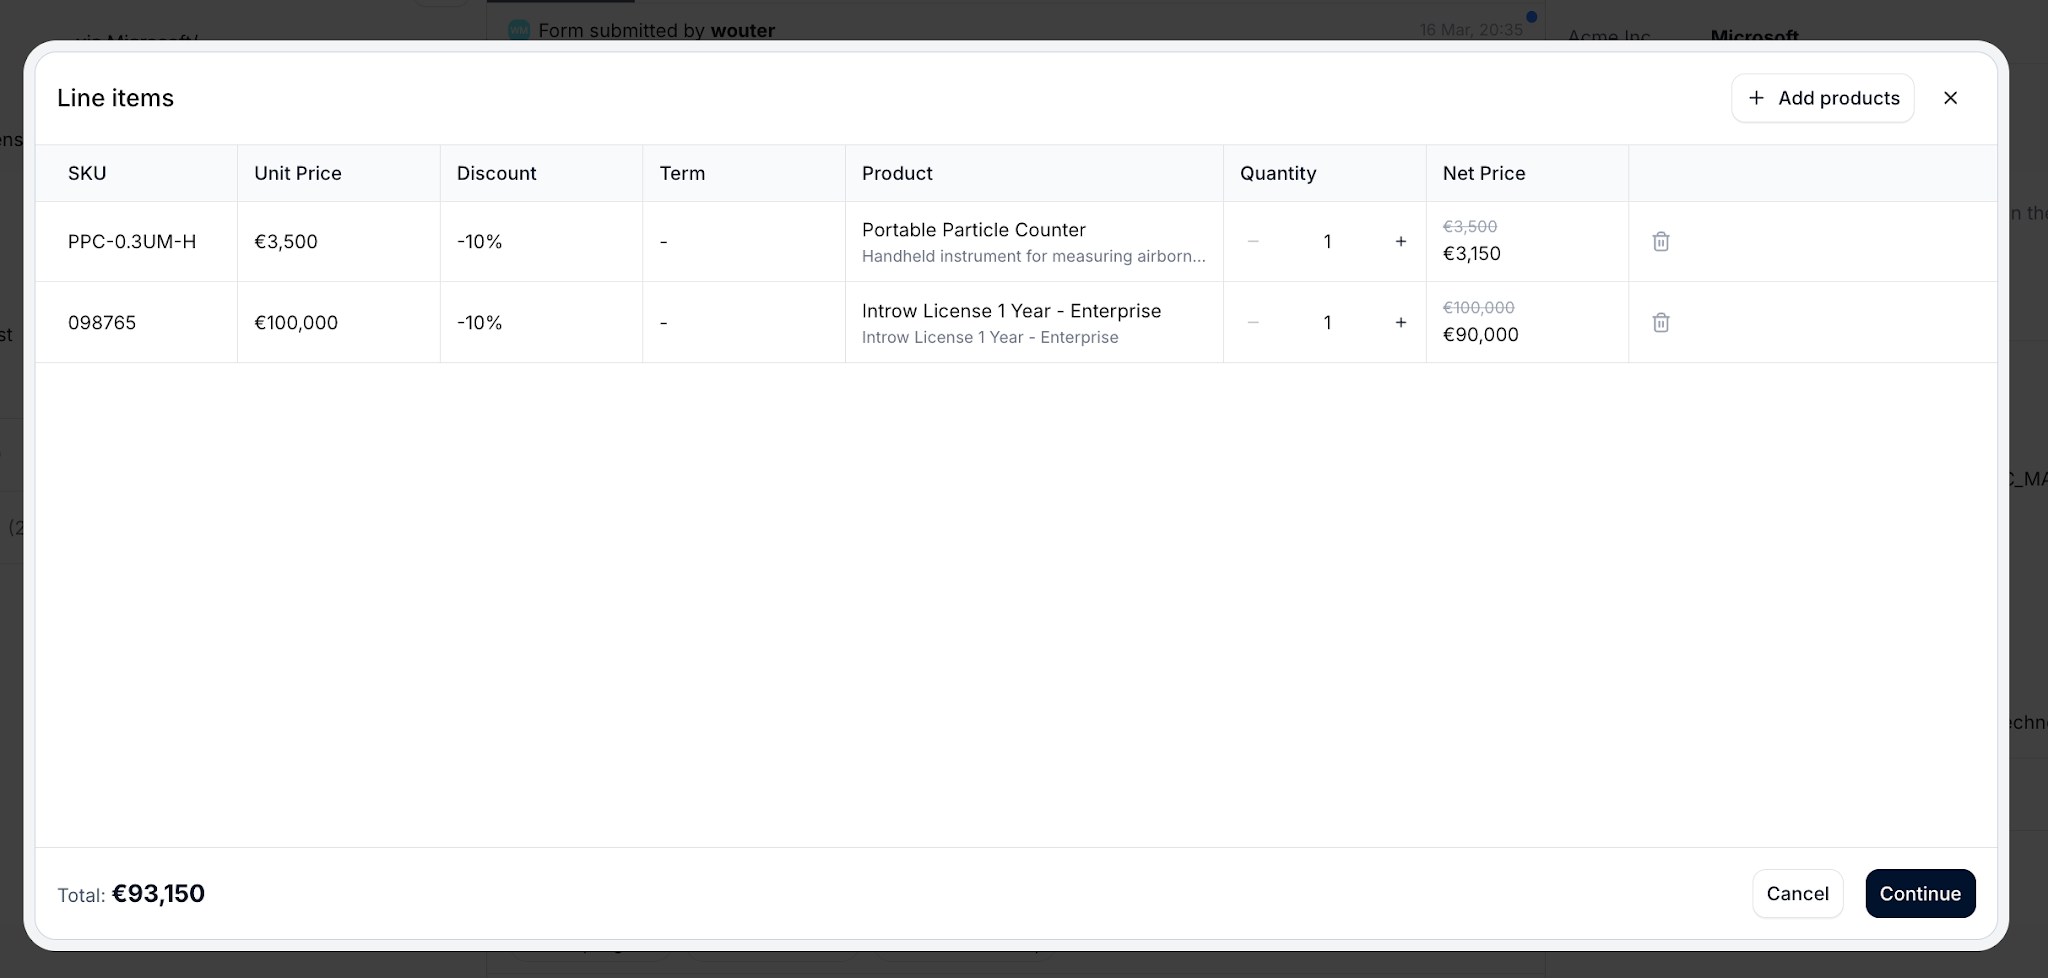
6) Content adoption rate
Content adoption rate tracks how frequently partners access sales collateral, pitch decks, and marketing assets. If content exists but isn’t used, it’s not enablement — it’s clutter.
Why it matters: Content adoption tells you what partners actually use in the field — and what you should stop spending time on.
How to track it: Track downloads, views, and shares inside your partner portal. Low adoption on a specific asset is a signal to update it, reposition it, or retire it.
7) Partner portal engagement
Partner portal engagement includes login frequency, session duration, and pages viewed. It’s an imperfect metric, but still useful when you interpret it correctly.
Why it matters: Engaged partners stay informed on messaging, launches, and plays — and they tend to bring you into deals earlier.
How to track it: Tie portal analytics to partner account records in your CRM. Low portal engagement may signal login friction. Partners who can collaborate without logging in — via email or Slack — often stay more active than partners who face a login wall every time.
8) Partner satisfaction score
Partner satisfaction score is a survey-based metric capturing partner experience with your program. This is your early warning system — partners usually disengage before they churn.
Why it matters: Dissatisfied partners deprioritize you in favor of vendors who make it easier to sell.
How to track it: Run NPS or CSAT surveys at key milestones: post-onboarding, quarterly, and after major program changes. Declining scores point to specific fixes — unclear rules of engagement, slow deal support, messy content, or weak enablement.
How to track partner enablement and performance metrics in your CRM
If you’re building a partner motion in 2026, your CRM can’t be optional. Tracking KPIs inside HubSpot or Salesforce gives Sales, Partnerships, and RevOps real-time visibility into the same truth — and removes the “whose spreadsheet is right?” debate during QBRs.
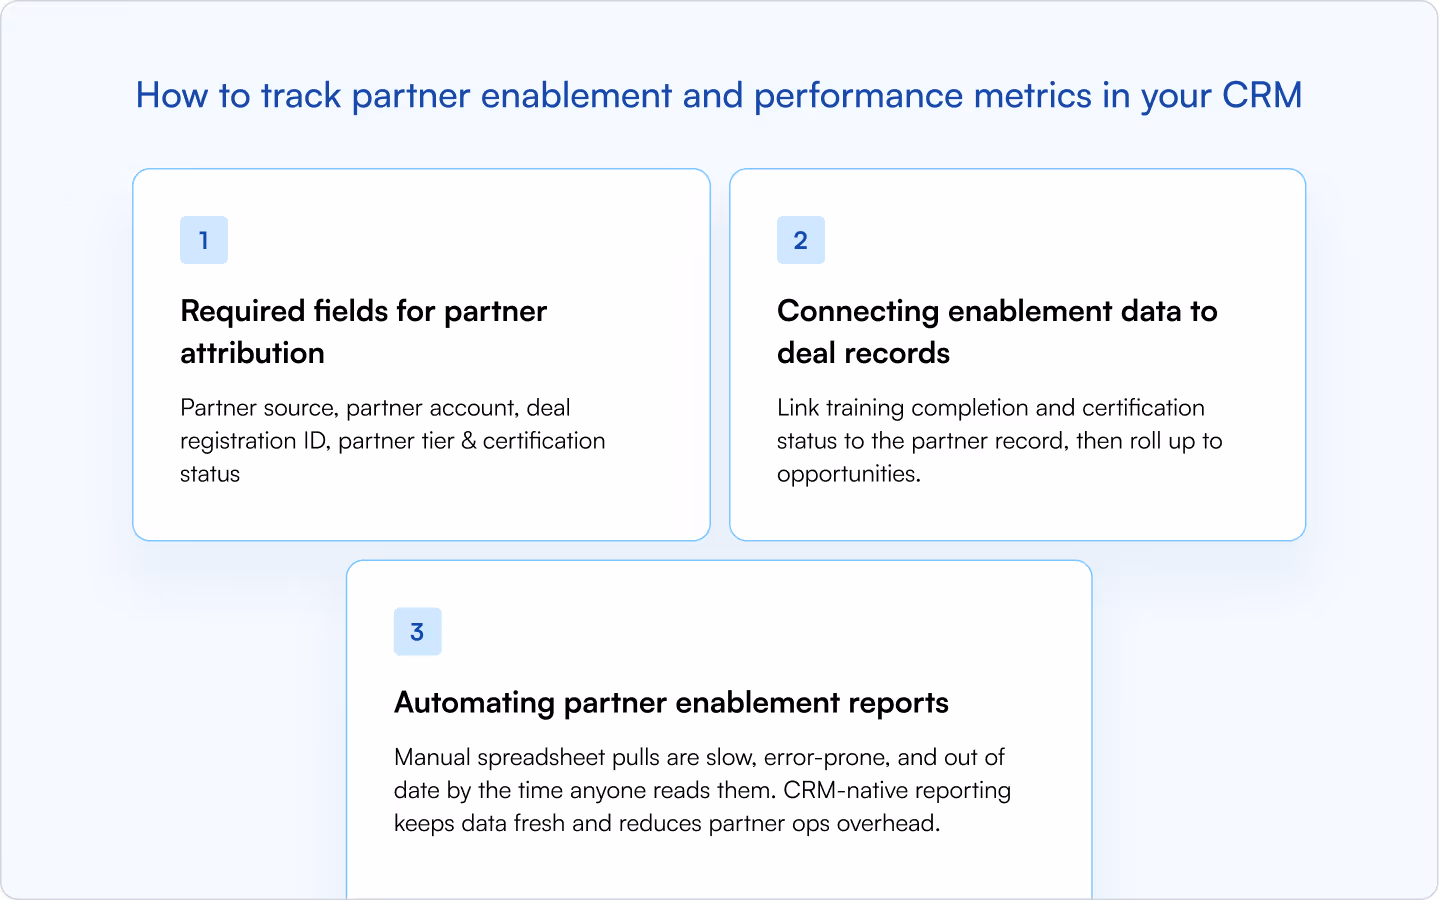
Required fields for partner attribution
Your CRM data model determines what you can measure. Without the right fields, you’ll be stuck with manual reconciliation and fuzzy attribution.
- Partner source: Sourced vs. influenced
- Partner account: Link to partner company record
- Deal registration ID: Ties opportunity to registration
- Partner tier: Segment partner performance metrics by tier
- Certification status: Correlate training to outcomes
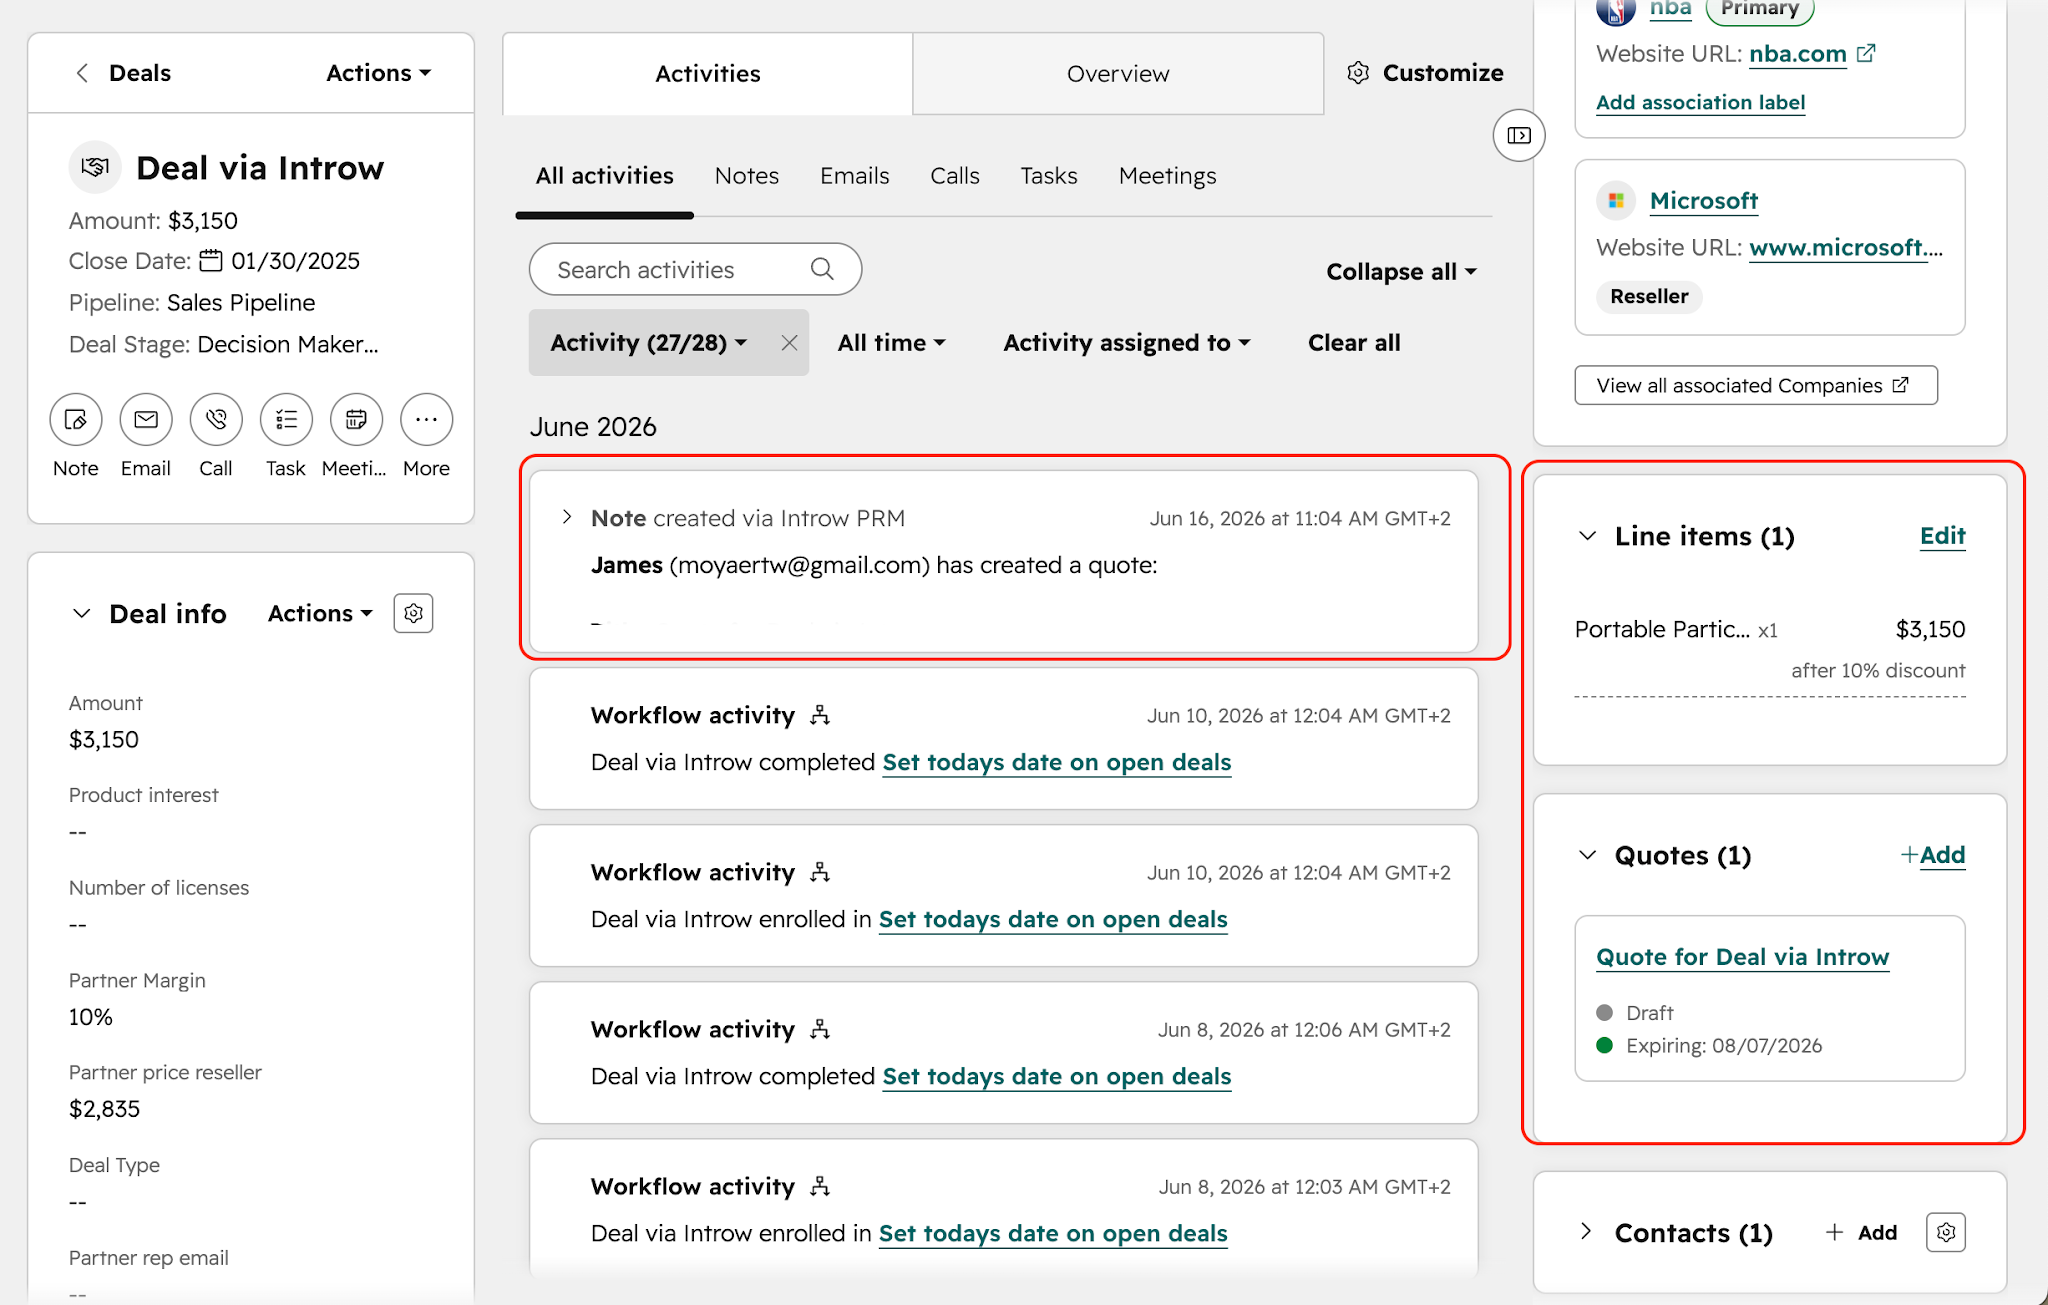
Connecting enablement data to deal records
Link training completion and certification status to the partner record, then roll up to opportunities. This is how you answer executive-level questions with data:
- Do certified partners close bigger deals?
- Which training modules correlate with faster deal cycles?
- Does onboarding completion predict partner-sourced pipeline within 90 days?
The connection between enablement and outcomes is where most programs fall short. If your LMS and CRM don’t talk to each other, you’ll keep measuring activity without understanding impact.
Automating partner enablement reports
Manual spreadsheet pulls are slow, error-prone, and out of date by the time anyone reads them. CRM-native reporting keeps data fresh and reduces partner ops overhead.
What to automate weekly:
- Expiring deal registrations and stalled registered opportunities
- Training completion trends by tier and cohort
- Partner-sourced pipeline by stage and expected close date
Automating both partner enablement KPIs and partner performance metrics helps you spend QBR time on decisions — not on attribution debates.
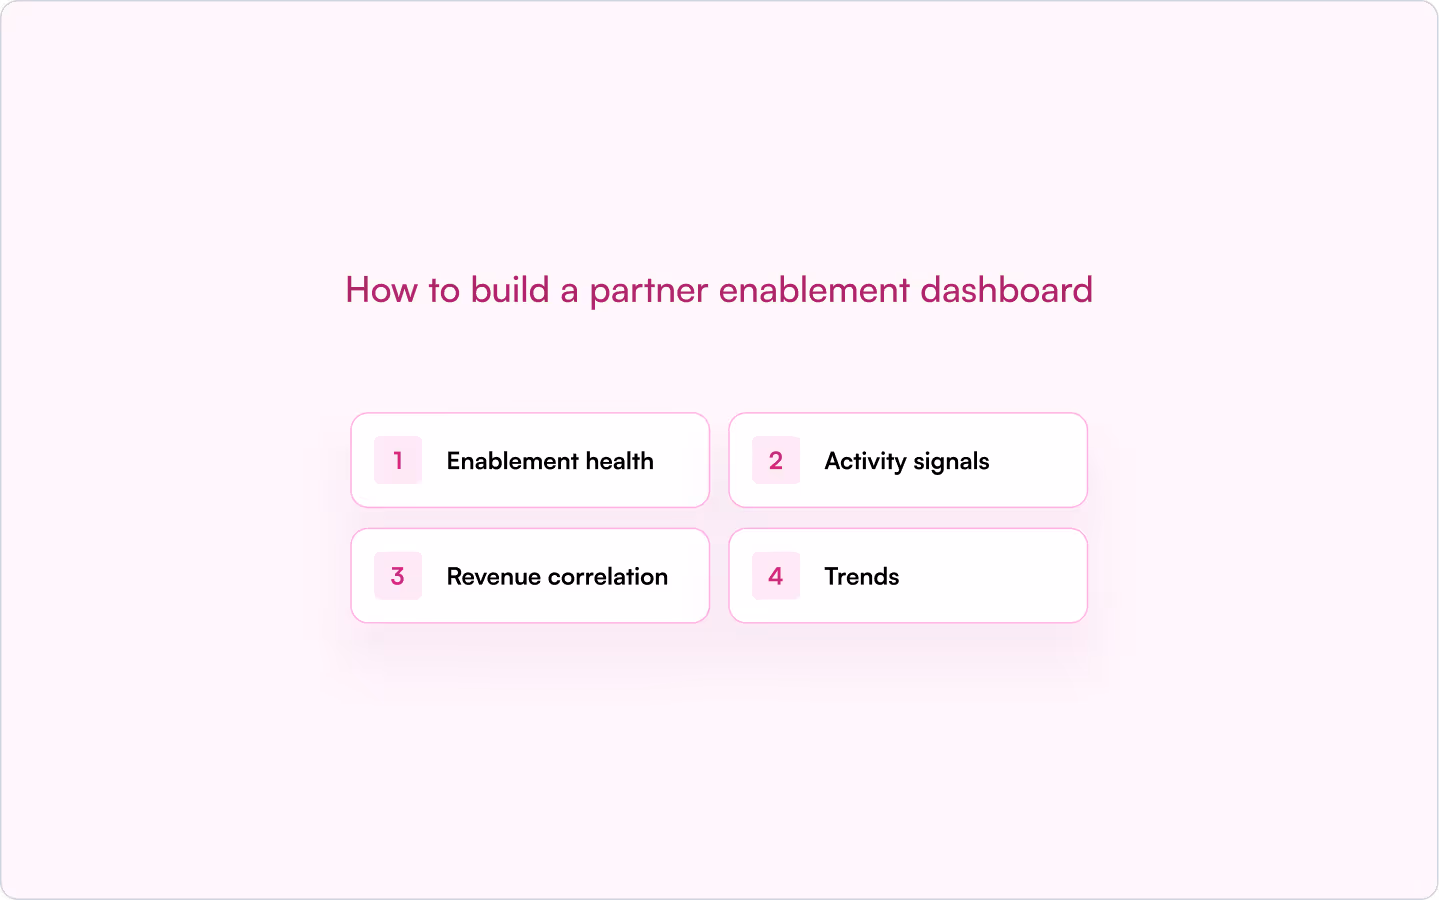
How to build a partner enablement dashboard (that leadership will actually trust)
A dashboard is only useful if it lives where your team already works. The best dashboards sit inside the CRM so leadership sees partner data alongside direct sales.
Include these dashboard components:
- Enablement health: onboarding completion, training completion, content adoption
- Activity signals: portal logins, deal registrations, content downloads
- Revenue correlation: partner-sourced revenue by enablement stage (new, trained, certified)
- Trends: month-over-month changes to spot issues early
When enablement and revenue show up in the same view, you can quickly see which partners are ramping and which are stalling. That visibility makes it easier to intervene early — before a partner disengages entirely.
Turn partner enablement data into repeatable revenue
Measuring KPIs for measuring partner enablement program success isn’t about producing more reports. It’s about building a partner motion that scales — with clear signals for what to fix, what to standardize, and where to invest.
When you track enablement metrics, deal registrations, and partner activity inside your CRM, you get real-time visibility without chasing partners for updates. You can see which training programs correlate with faster deal cycles, which content partners actually use, and which onboarding steps predict long-term engagement.
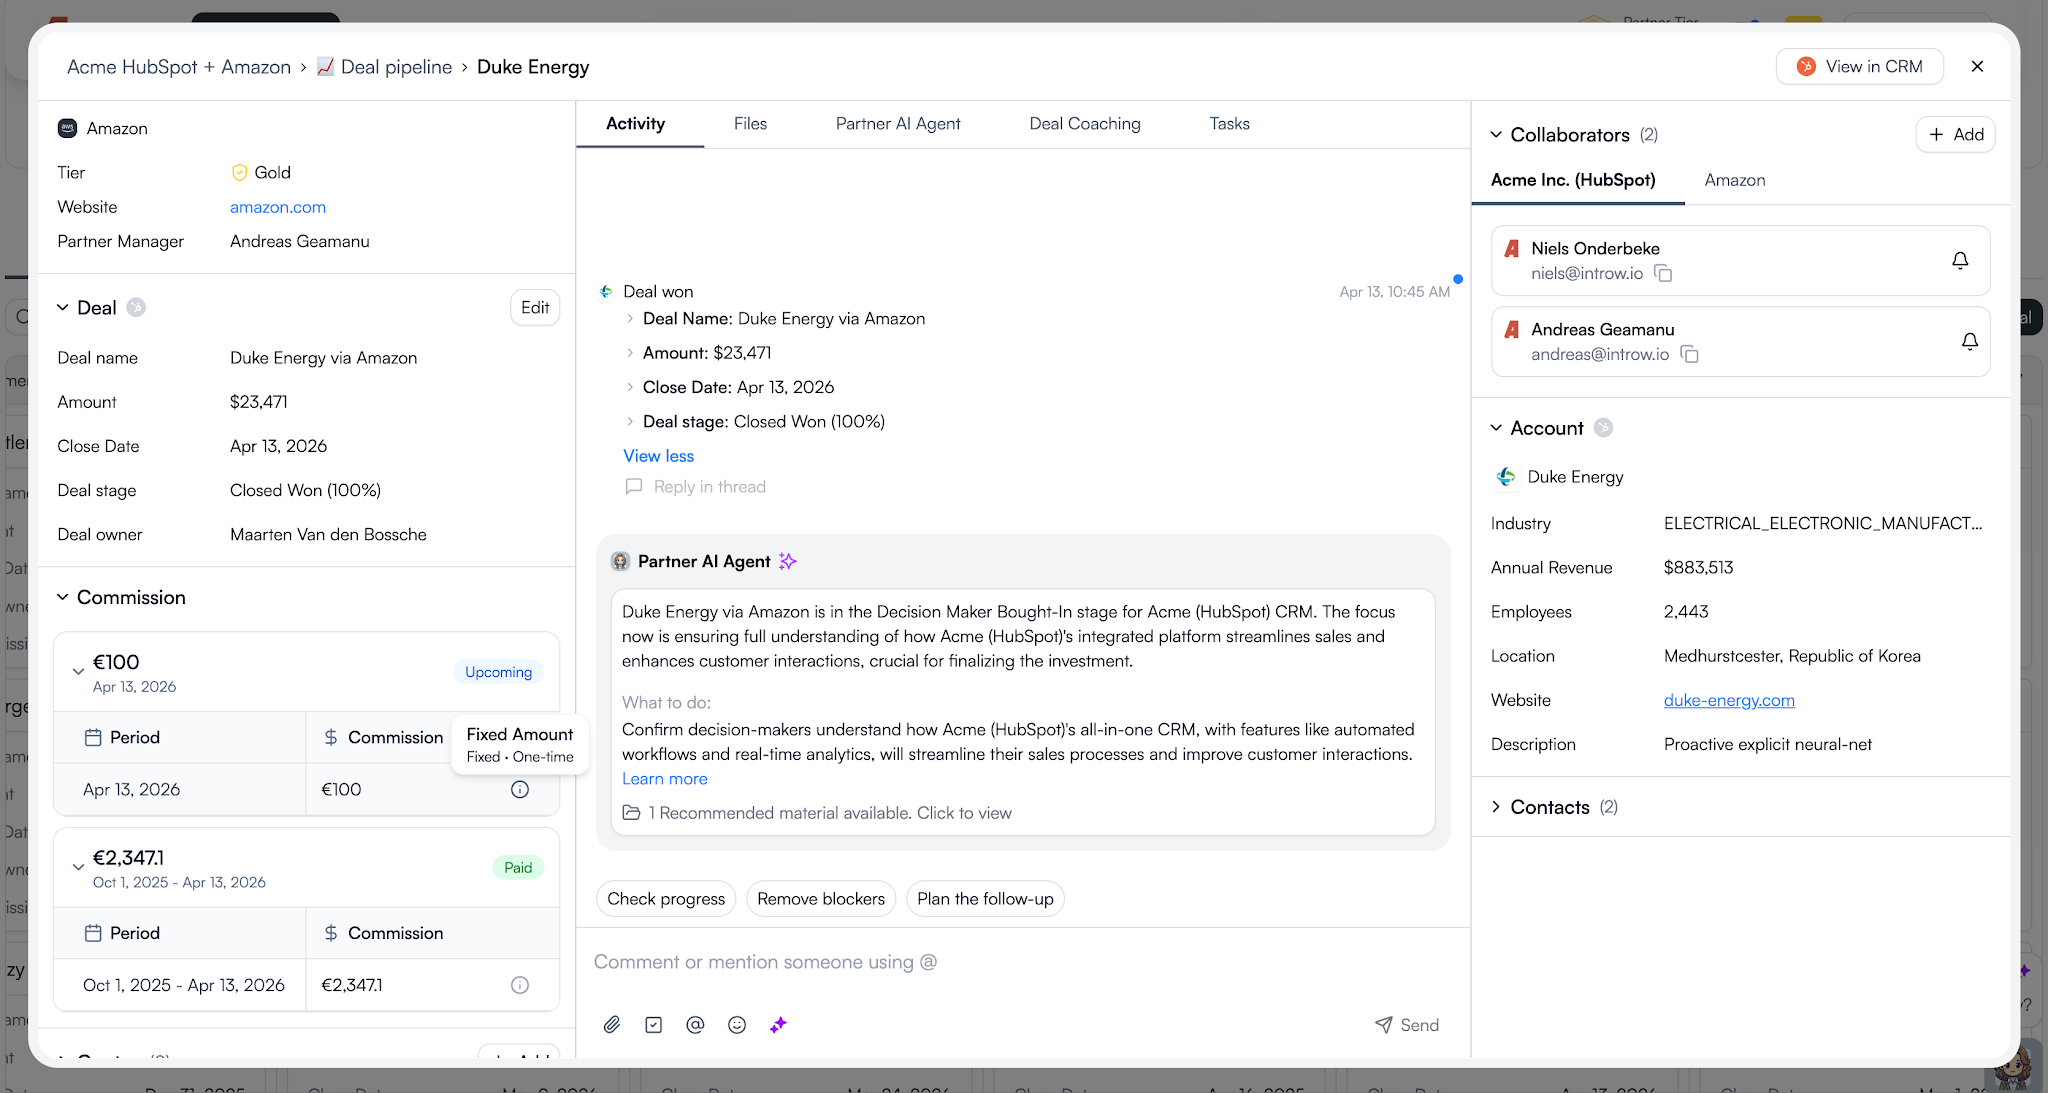
A CRM-first PRM like Introw keeps all of this in HubSpot or Salesforce, so your team and your partners work from the same source of truth.
Subtle next step: If you’re already tracking deals in HubSpot or Salesforce, start by adding the attribution fields above and building a simple dashboard. You’ll learn more in two weeks of clean data than in a quarter of portal “engagement” guesses.
Ready to track partner enablement KPIs inside your CRM? Get a demo.
How often should partner teams review enablement KPIs?
Review cadence depends on the metric. Activity and friction signals should be monitored frequently, while outcome metrics need more time to mature: - Weekly: deal registration volume, portal engagement, content adoption (to catch friction early) - Monthly: onboarding completion rate, training and certification completion (to manage cohorts) - Quarterly: partner-sourced revenue, time to first deal (to evaluate program ROI)
What is a good benchmark for partner onboarding completion rate?
Benchmarks vary widely by partner type (SI vs. reseller vs. affiliate), deal complexity, and how long onboarding takes. The most useful benchmark is your own baseline, measured by cohort. As a practical target, aim for consistent quarter-over-quarter improvement. Even a 10% lift in onboarding completion can translate into a measurable increase in activated partners — especially if your onboarding includes the steps required to register and co-sell deals.
How can partner teams measure enablement ROI if partners rarely log into the portal?
Don’t treat portal logins as the only engagement signal. Many strong partners work “off-portal” through: - deal registration submissions - email threads with partner managers - co-selling activity on specific opportunities - attendance in live trainings or office hours The key is to sync those actions back to the CRM so your enablement KPIs reflect how partners actually work — not how you wish they worked.
Should partner-sourced and partner-influenced revenue be weighted differently in KPI reporting?
Track them separately. Partner-sourced revenue measures deals partners originated, while partner-influenced revenue captures deals where partners assisted but didn’t originate. Combining them can hide what your enablement investment is truly producing. If leadership needs a blended view, create one — but keep the sourced vs. influenced split available so you can diagnose performance accurately.
What’s the biggest mistake teams make when reporting partner enablement KPIs?
Reporting only leading indicators (like training completions) without tying them to pipeline and revenue. That’s how partner enablement becomes a cost center. The fix is simple: keep enablement KPIs, but always pair them with performance metrics in the same dashboard and the same reporting cadence.


.png)
.png)
.png)
.png)
.png)
.png)
.png)
.png)
.png)
.png)
.png)


.png)
.png)
.png)
.png)
.png)
.png)
.png)
.png)
.png)
.png)
.png)
.png)
.png)
.png)
.png)
.png)
.png)
.png)