

Partner performance metrics show whether partners are moving from onboarding to qualified pipeline, revenue, and durable customer relationships, and whether those results justify the program's cost. Measure activity, output, and economics separately. When a number slips, diagnose the cause before changing a target or blaming a partner.
A short partner scorecard is enough if each KPI has a clear formula, a fair comparison group, and an action attached. Review new partners by cohort, compare partner-led deals with similar direct deals, and track your own team's response times alongside partner results.
One reseller registers fifteen deals, twelve rejected. Another registers four, closes three, and brings renewing customers.
More activity did not identify the stronger partner.
For partner managers and RevOps, the question is what a number means and what happens next. These key performance indicators (KPIs) turn partnership metrics into decisions. For broader roster-level investment and intervention decisions, see our channel partner performance management guide.
What partner performance metrics actually measure
Partner performance metrics fall into three groups. Partner program leaders should keep their purposes separate:
- Activity: Partner engagement signals such as completed training, partner portal activity, and leads submitted. They are easy to track and sometimes easy to inflate.
- Output: What those actions produced, such as approved partner deals, qualified pipeline value, customers acquired, and revenue.
- Economics: How much output costs across the partner program, including funding for co-marketing initiatives.

Prioritize output and economics. Keep activity as diagnostic evidence: a completed course might explain why a seller is ready, but isn't proof that the seller can win. When partner logins or submissions become targets, partners can hit them without improving results.
Measure the vendor too. Registration approval time, response to partner questions, and promised presales support all affect what a partner can deliver. A partner waiting two weeks for a decision may look unproductive even though the bottleneck belongs to your team. Track vendor service metrics beside partner KPIs. To measure partner satisfaction, pair a short pulse survey with approval times and support tickets; poor support can weaken the partner relationship.
Core partner KPIs by lifecycle stage
Follow the partner from signed agreement to retained customer. For each stage, define the denominator and window, interpret weak readings, then test a response. These are signals, not benchmarks.
Activation: did a new partner reach first pipeline?
- Activation rate = partners in a signing cohort with a first registered deal or partner referral within a fixed window ÷ all partners in that eligible cohort × 100. Choose a 90-day window, for example, and compare mature cohorts.
- Time to first deal is the number of days between signing and the first registration; state explicitly if your program uses first closed-won instead.
- Dormant partner share = onboarded partners with no registrations in the review period ÷ all onboarded partners in that group × 100.
When partners disengage, low activation may indicate onboarding friction, poor fit, or no clear next action. Keep partners engaged with first-deal check-ins. Simplify registration, agree a first-deal goal, and check in before the window closes. Compare referral partners with peers, not systems integrators, whose sales process differs. For interventions, see partner activation.
Partner enablement and engagement: does readiness lead to pipeline?
- Certification coverage = active partners meeting the required credential bar ÷ partners eligible for it. Compare certification completion rates within the same partner group.
- Certification currency = valid, unexpired credentials ÷ credentials held.
- Training completion rate = assigned courses completed ÷ assigned courses due in the period.
Weak partner enablement coverage suggests irrelevant training programs, access friction, or weak benefits. Use certification programs and enablement sessions that help partners win a first deal. Then test whether certified partners produce better qualified pipeline and win rates than comparable uncertified peers. Completion alone cannot answer that.
Pipeline: are registrations credible and progressing?
- Partner-sourced pipeline is the pipeline value of open opportunities the partner originated, not revenue generated from closed deals.
- Partner-influenced pipeline covers opportunities originated elsewhere where the partner played a defined role. Report them separately; give each deal one primary role for unduplicated totals and retain additional contributors.
- Registration volume counts deals registered, including submissions awaiting review.
- Approval rate = approved registrations ÷ submissions with a final approval decision.
- Registration-to-close rate = closed-won approved registrations ÷ approved registrations in a defined, sufficiently mature cohort. Exclude pending registrations from approval rate, and let approved deals mature before measuring closes.
- Vendor-side time to decision = elapsed time from submission to final decision.
Weak approval conversion rates may reflect low lead quality, unclear rules, or direct ownership. Check the sales funnel. Inspect rejection reasons first. A high count of leads generated can conceal speculative registrations, so review approval and close rates together. Track the age of active deals separately. If that grows, fix your internal queue before coaching partners.
Revenue, customer satisfaction, and retention: are deals worth winning?
- Win rate = closed-won opportunities ÷ all closed opportunities, measured for the same cohort, product, and period.
- Average deal size = closed-won deal value ÷ closed-won deals.
- Sales cycle = average days from the agreed starting milestone to close for won deals.
Compare each with direct sales serving similar customers rather than the company-wide average.
- Gross revenue retention = starting recurring revenue minus churn and contraction, divided by starting recurring revenue.
- Net revenue retention also adds expansion revenue from the same starting cohort in the numerator. Keep the same customer cohort and revenue basis.
Weak win rate, low deal value, low customer satisfaction, or early churn may point to poor fit, missing skills, excess discounting, or delivery issues after the sale. Tighten qualification, offer additional training, and inspect handoffs to the customers served. A quick close means little if the customer soon churns. Review whether cross-sell activity improves customer outcomes, not just deal value.
Program economics: do returns justify the cost?
- Cost of channel = program costs ÷ partner-attributed revenue for the same period, expressed as a percentage. Specify what counts as partner program revenue. Include allocated team expense, technology, incentives, and enablement, not just commissions. State whether the denominator is recognized revenue or another consistent financial base.
- MDF return ratio = attributable revenue or pipeline from a funded initiative ÷ MDF actually spent. Label which numerator you chose: a pipeline multiple isn't a profit ROI calculation.
A high cost ratio may indicate underused capacity, weak partner profitability, or funding with little financial impact. Review expenses by partner group before reducing support. Revenue generation alone says little about profit. This is not partner program ROI.
How to evaluate partner performance over time
A quarter shows who closed deals, not whether onboarding, capacity, or reporting changed. Treat performance as comparable observations to assess the partnership program's effectiveness.
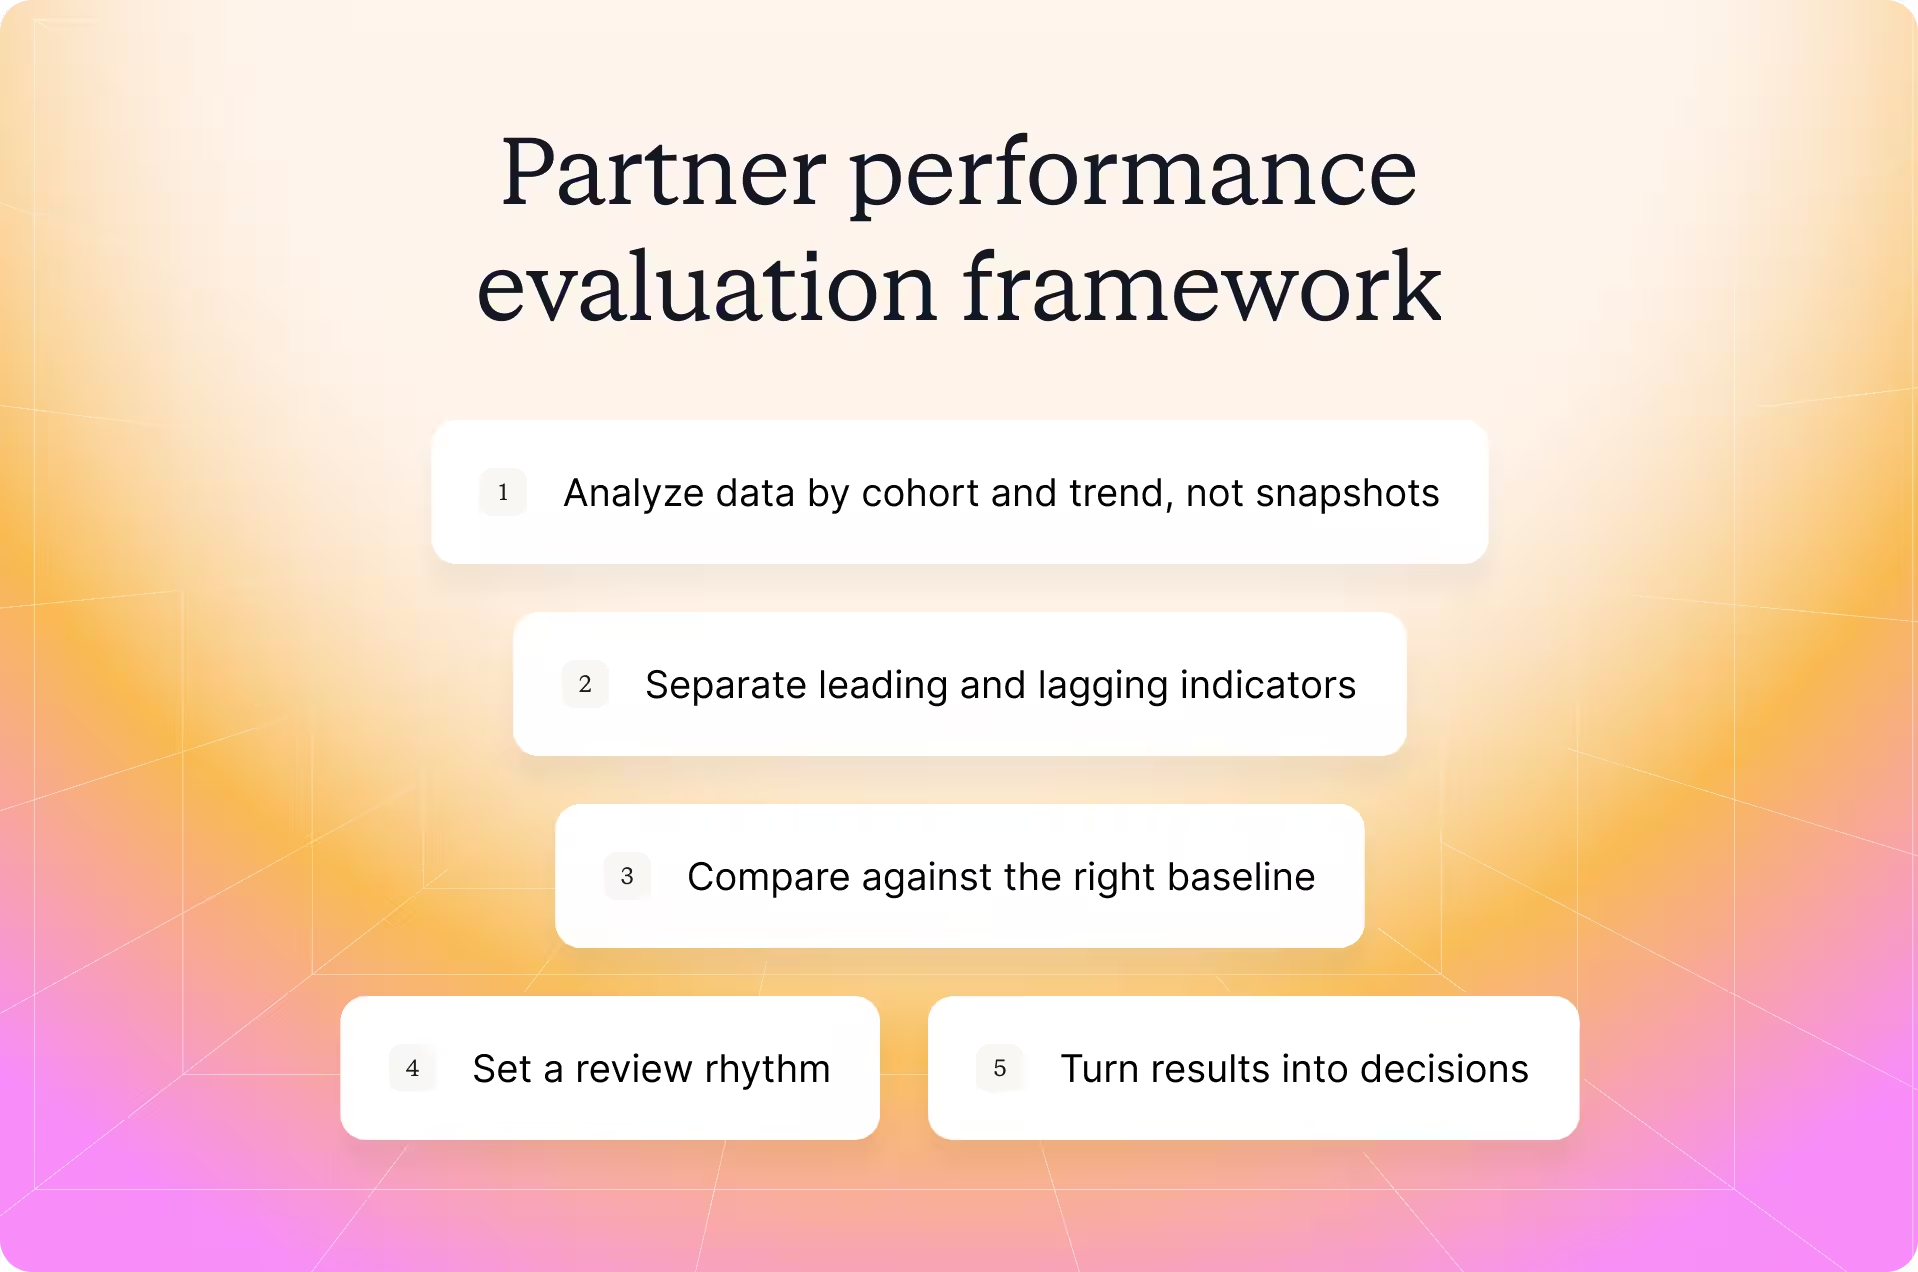
Analyze data by cohort and trend, not snapshots
Group partners by the quarter they joined and compare each cohort at the same age: 90 days, six months, or twelve months after signing. Separately, track an established partner's own trend. An activation dip may reflect onboarding changes. Don't compare new partners with veterans.
Separate leading and lagging indicators
Leading signals include activation, approved registrations, partner engagement, and qualified pipeline. Lagging measures include won revenue, retention, and realized win rates. Use both, but test the relationship annually. If registrations rise for three quarters without improving qualified pipeline or closed revenue, your registration count is not doing its forecasting job. Revise the signal or its qualification rules instead of celebrating the trend.
Compare against the right baseline
Use three views: partner history, peers of the same type and maturity, and a relevant direct sales comparison. Match customer segment, geography, product, deal size, and observation period where possible. Blended reseller, agency, and integrator averages hide differences. Use consistent partner ecosystem groups.
Set a review rhythm
Review active deals and enablement monthly; revisit partner tiering, resource commitments, and joint business plans quarterly. This is practitioner guidance, not an industry benchmark. Send figures to key stakeholders beforehand; use the meeting to track progress and make decisions.
Turn results into decisions
A review should end with support, hold, promote, or consider demotion, plus an owner and a date to recheck. Partner satisfaction can help interpret partnership health, but should not override verified customer results. If a partner misses a goal because your team delayed approvals, fix that first. Where a tier change is warranted, apply documented criteria, give notice, and allow reasonable time to recover. Record each intervention so you can measure success against the next comparable period. For a strategic partnership, revisit the partnership strategy before changing support commitments.
Build a partner scorecard people use
Start with roughly eight to ten partnership KPIs, selected for your partner program's stage. Treat this as a starting point, not a standard.
| Program stage | Prioritize | Decision it supports |
|---|---|---|
| New | Activation rate, time to first deal, approved registrations | Fix onboarding or partner fit |
| Growing | Sourced pipeline, approval and close rates, win rate vs. direct, certification coverage | Improve deal quality and capability |
| Mature | Partner-sold retention, cost of channel | Decide where to invest or change economics |
For every KPI, document the formula, denominator, revenue basis, CRM field, owner, reporting window, and review frequency. Keep definitions stable across periods; mixing annual contract value with recognized revenue, or changing which influenced deals count, makes trends meaningless. Track unique opportunity IDs to avoid attributing the same total more than once.
Build both an internal view and a partner-facing one. The partner should see its pipeline, goals, and next actions without access to other partners' records. Include registration decision time and support response time in the internal view so the scorecard measures vendor execution too. A scorecard supports data-driven decisions, not just reporting. Use this diagnosis-to-action matrix:
| KPI family | Weak reading might mean | First lever to test |
|---|---|---|
| Activation | Unclear first step | Guided first referral |
| Enablement | Training lacks relevance | Role-specific course |
| Pipeline | Low approval quality | Review rejection reasons |
| Revenue quality | Poor-fit customers | Tighten qualification |
| Economics | Cost exceeds return | Reallocate support |
How metrics change by partner type
Keep calculations consistent while changing their emphasis by partner type.
Referral partners need measures of leads generated, acceptance, and time to first referral. Check whether referrals generate leads sales accepts. Compare acceptance with close rate to spot whether problems begin with prospect fit or later in sales efforts.
Resellers warrant attention to approved registrations, won revenue, deal size and win rate versus direct sales, customer retention, and certifications. Volume without quality should never determine the assessment.
Technology and integration partners call for integration adoption, shared-customer outcomes, and co-marketing activities or co-selling outcomes, separating activity from attributable value.
Implementation partners need measures of delivery quality, certifications, customer satisfaction, and retention. Weak delivery damages customer value despite healthy pipeline.
How Introw helps with partner performance
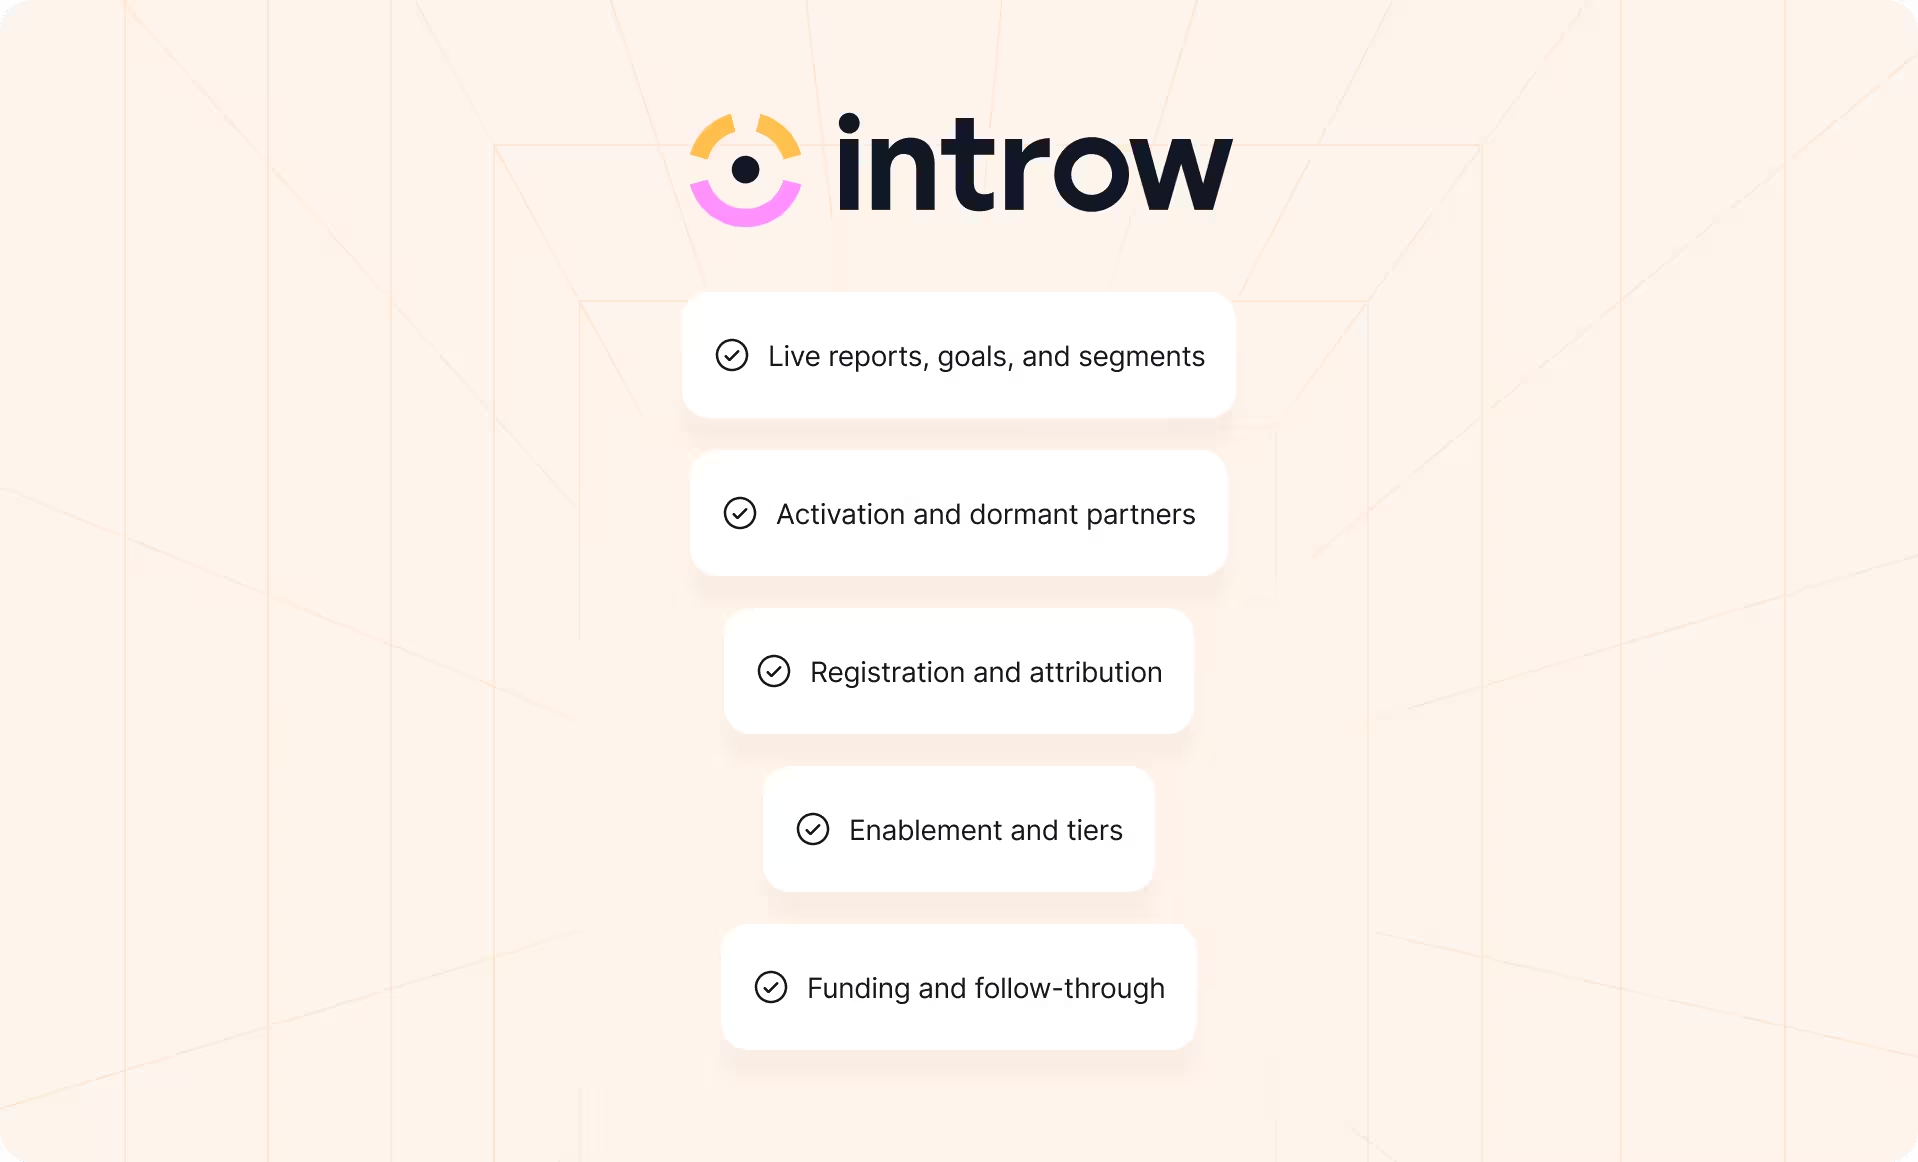
Introw connects partner activity and outcomes to HubSpot or Salesforce, so partnership teams can analyze data and act on it.
- Live reports, goals, and segments: Partner performance dashboards can combine CRM deals with engagement and certification signals and appear in each partner's portal, automatically scoped to that partner. Goals can track filtered CRM records, with tier-specific or partner-specific targets. Dynamic segments help identify areas of weak partner performance within comparable groups.
- Activation and dormant partners: Activity and deal-registration history make it possible to spot partners who completed onboarding but have no first opportunity. An activation workflow or AI-assisted recommendation can suggest a relevant intervention, such as a check-in, warm introduction, or focused training. Teams should verify the trigger and own the follow-up.
- Registration and attribution: Deal submissions connect to CRM opportunities, with approval and conflict checks that reveal where registration slows. Sourced and influenced roles can be recorded on deals, including multiple partner contributors, while reporting rules prevent counting the same revenue twice.
- Enablement and tiers: Courses and certificates make readiness visible alongside pipeline. Partner tiers can use CRM-linked requirements and goals; periodic review can support promotion or intervention without treating a single missed quarter as automatic grounds for demotion.
- Funding and follow-through: MDF records connect requests, approvals, and claims to campaign spending. Commission records support the incentive-cost picture. Partner notifications and workflows can alert owners when CRM deal activity changes or follow-up is due.
Want your partner scorecard connected to the deals your team already tracks? Start free and connect HubSpot or Salesforce.
Still curious? Here are some quick answers to help clear things up
Partner performance metrics measure what partners do, what their work produces, and what the relationship costs to run. Activity, output, and economics belong in separate categories so activity is not mistaken for commercial return. Useful KPIs guide partner performance decisions, not just reporting.
Examples include activation rate, deal registration approval rate, partner-sourced pipeline, win rate against comparable direct deals, customer retention, and cost of channel. Each needs a defined cohort and denominator. Choose the measures that reflect your partner motion.
Start with about six to ten, depending on program maturity and the decisions you need to make. That is practical guidance, not a benchmark. Replace a metric when it stops predicting an outcome or informing a useful action.
Partner-sourced revenue comes from opportunities the partner originated. Partner-influenced revenue comes from opportunities that started elsewhere but received a defined partner contribution. Report them separately and assign each deal one primary attribution role for unduplicated totals.
Monthly operational reviews and quarterly strategic reviews are a common starting rhythm. Look at live pipeline and support bottlenecks more often when needed. Keep definitions stable so the trend you are discussing reflects performance, not changed accounting.





See AI-Native PRM in Action
Book a demo with one of our partner program experts, or explore Introw on your own time.