.svg)


Most partner teams can tell you how many partners completed training last quarter. Far fewer can tell you whether that training actually led to more deals, faster ramp times, or higher revenue per partner through proper partner analytics.
That gap — between activity and impact — is where enablement programs stall. In this guide, you’ll get a focused set of partner enablement training metrics to track, how to separate leading indicators from lagging ones, and how to wire the whole thing into your CRM so you can defend enablement spend with revenue outcomes.
Why partner enablement training metrics matter
Partner enablement training metrics are the KPIs that show whether your onboarding, training content, and certifications translate into real partner performance. If you’re building a channel like a founder builds a product, these metrics are your instrumentation — they tell you what’s working, what’s broken, and where your next iteration should go.
The common failure mode is measuring “inputs” (courses published, partners invited, sessions delivered) but not “outputs” (pipeline created, deals closed, revenue retained). When leadership asks, “Is this working?” you end up assembling a last-minute spreadsheet instead of opening a dashboard with a clear story.
The right partner enablement training metrics to track close that gap. They help you:
- Prove ROI on training and certification investments.
- Identify stuck partners early (before churn or inactivity becomes the default).
- Standardize coaching with objective signals instead of gut feel.
- Scale your program without adding headcount just to report on it.
Leading vs. lagging indicators for partner training (and why you need both)
If you only track lagging indicators like revenue, you’ll find out something went wrong after the quarter is over. If you only track leading indicators like course completions, you can end up celebrating progress that never turns into pipeline.
What are leading indicators?
Leading indicators are early signals that predict future performance. They’re especially valuable in partner programs because the time between “trained” and “producing revenue” can be long.
- Course enrollment rate: the percentage of partners who start assigned training — a signal of awareness and initial buy-in.
- Module completion velocity: how quickly partners move through onboarding content — often correlated with motivation and readiness.
- Content engagement: which resources partners access, how often, and where they drop off — useful for iterating your curriculum.
What are lagging indicators?
Lagging indicators are outcome-based metrics that confirm whether enablement drove business results. They’re what you use to justify budget and to decide what to double down on.
- Revenue per certified partner: compares revenue from certified vs. non-certified partners — one of the cleanest ways to quantify training value.
- Deal close rate by partner tier: shows whether more advanced enablement correlates with better conversion.
- Time-to-first-deal: how long it takes a new partner to register and close their first deal after onboarding.
How to balance both in reporting
A simple operating model: review leading indicators weekly to catch issues early, and review lagging indicators monthly or quarterly to validate ROI. When a lagging metric slips, use your leading indicators to diagnose why.
Core partner enablement training metrics to track for onboarding and certification
Onboarding is where most partner programs quietly lose momentum. The partners who don’t ramp quickly become “inactive” on your roster — but they still show up in partner counts, which can hide the issue. These metrics make onboarding performance visible.

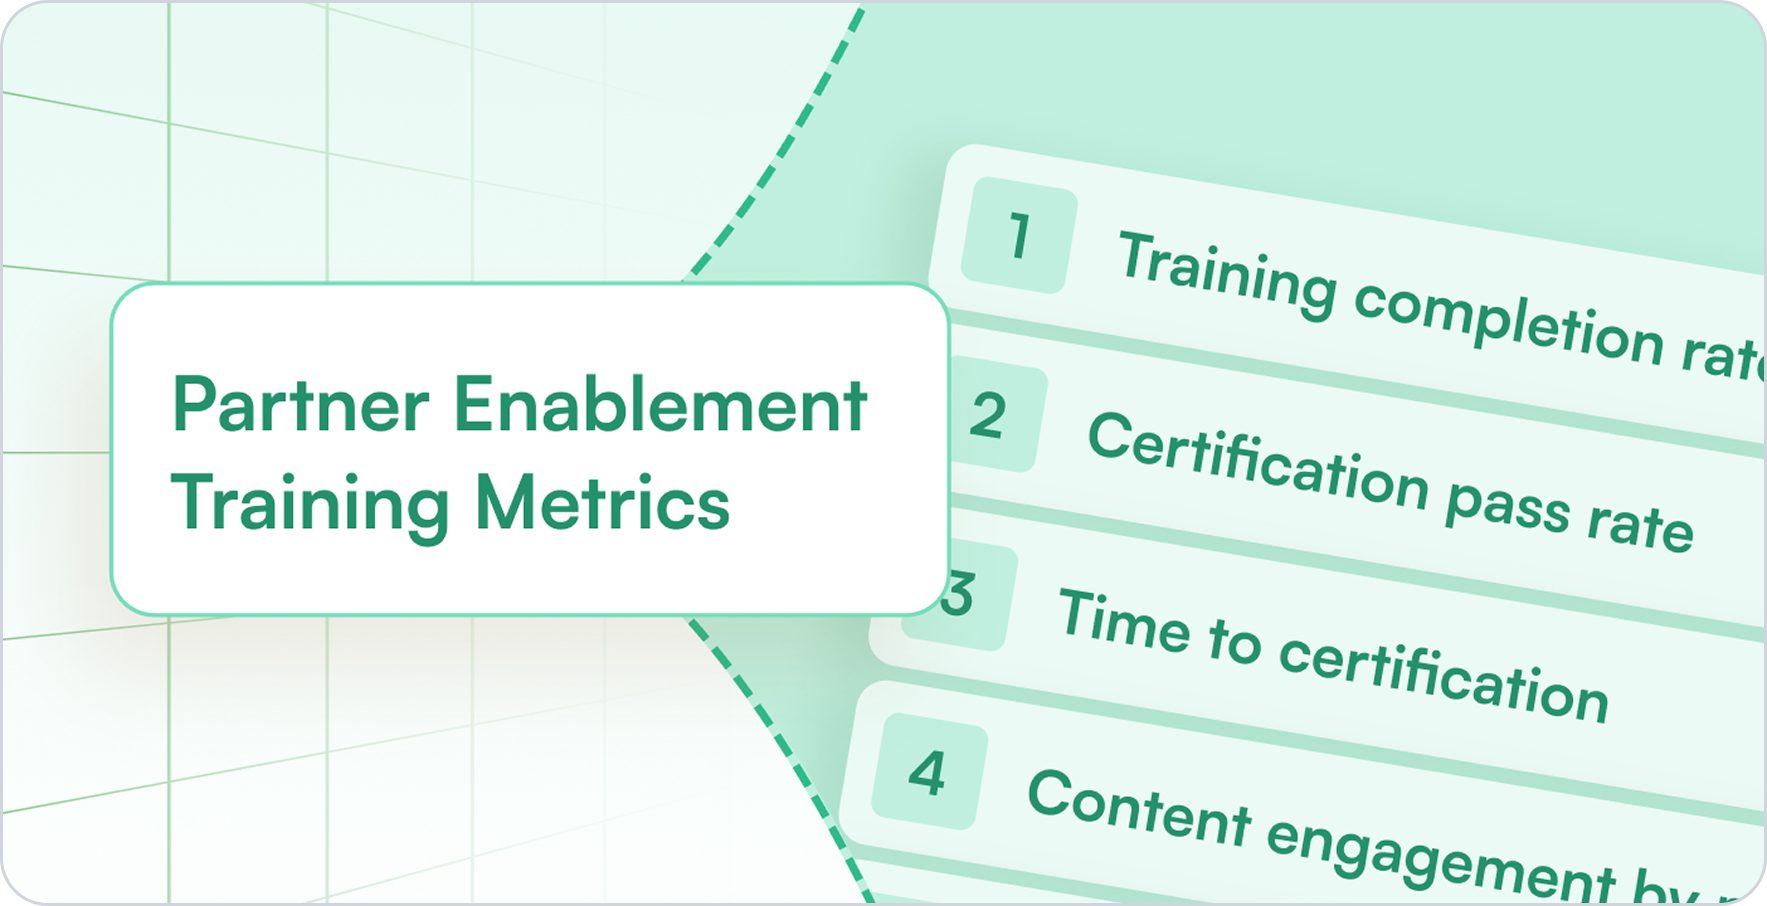
#1 Training completion rate
Training completion rate measures the percentage of partners who finish assigned courses or modules. Low completion typically signals friction: unclear value, too much content, or a path that doesn’t map to how partners actually sell.
#2 Certification pass rate
Certification pass rate tracks how many partners pass certification exams on their first or subsequent attempts. If the pass rate is low, one of two things is usually true:
- The training doesn’t prepare partners for the exam (content gap), or
- The exam tests the wrong things (misalignment with real selling scenarios).
By the way, did you know that partners who have passed the certification can share it with their LinkedIn network in just one click in the Introw platform? It’s an excellent opportunity for you and your partners to strengthen brand awareness and expand your reach.
#3 Time to certification
Time to certification is the number of days from onboarding start to certification completion. In practice, it’s a proxy for time-to-revenue: partners who ramp quickly tend to show up in your deal registration data sooner.
#4 Content engagement by module
Content engagement by module tracks views, completions, and drop-off rates for each training section. This is the fastest way to find:
- Modules that partners consistently skip (too long, too generic, or poorly positioned).
- Modules that correlate with better downstream performance (keep and expand).
- Points in the curriculum where motivation drops (reorder, shorten, or reframe).
Partner engagement metrics that signal enablement effectiveness
Completion is a milestone — engagement is the habit. If partners aren’t consistently returning for collateral, updates, and new training, your enablement program turns into a one-time event instead of a growth system.
#5 Partner portal login frequency
Portal login frequency measures how often partners access your portal. Low logins don’t automatically mean partners don’t care — they often mean access is painful (too many passwords, slow UI, unclear navigation). CRM-first portals with SSO typically see higher engagement because you remove the friction.
#6 Resource downloads and content views
Track how often partners download or view sales collateral (pitch decks, case studies, battlecards, pricing, playbooks). Interpret this metric carefully:
- High views: content is relevant, discoverable, and timed to real selling moments.
- Low views: partners may not know content exists, or they’ve decided it’s not useful.
#7 Announcement and communication read rates
Read rates show whether partners open and engage with updates (product changes, program rules, tier requirements, co-marketing opportunities). If read rates are consistently low, partners become out of sync — and those gaps tend to surface mid-deal when it’s expensive to fix.
Pipeline and revenue metrics tied to partner enablement
This is where enablement stops being a “nice-to-have” and becomes a growth lever. If you want leadership to fund training, you need a clean line from enablement to pipeline creation and revenue conversion.
#8 Deal registrations per certified partner
Compare deal registration volume between certified and non-certified partners. A common pattern is “certified but inactive” — partners finish training but don’t translate it into pipeline. When that happens, you may have:
- A mismatch between certification and the partner’s real motion,
- Missing incentives (no meaningful tier benefits or MDF access), or
- Partners who need enablement closer to live deals (e.g., deal coaching, joint calls).
#9 Time to first deal after certification
Time-to-first-deal measures how long it takes a newly certified partner to register and close their first opportunity. Shorter timelines mean your enablement is practical, not academic — and that you’re getting faster payback on training investment.
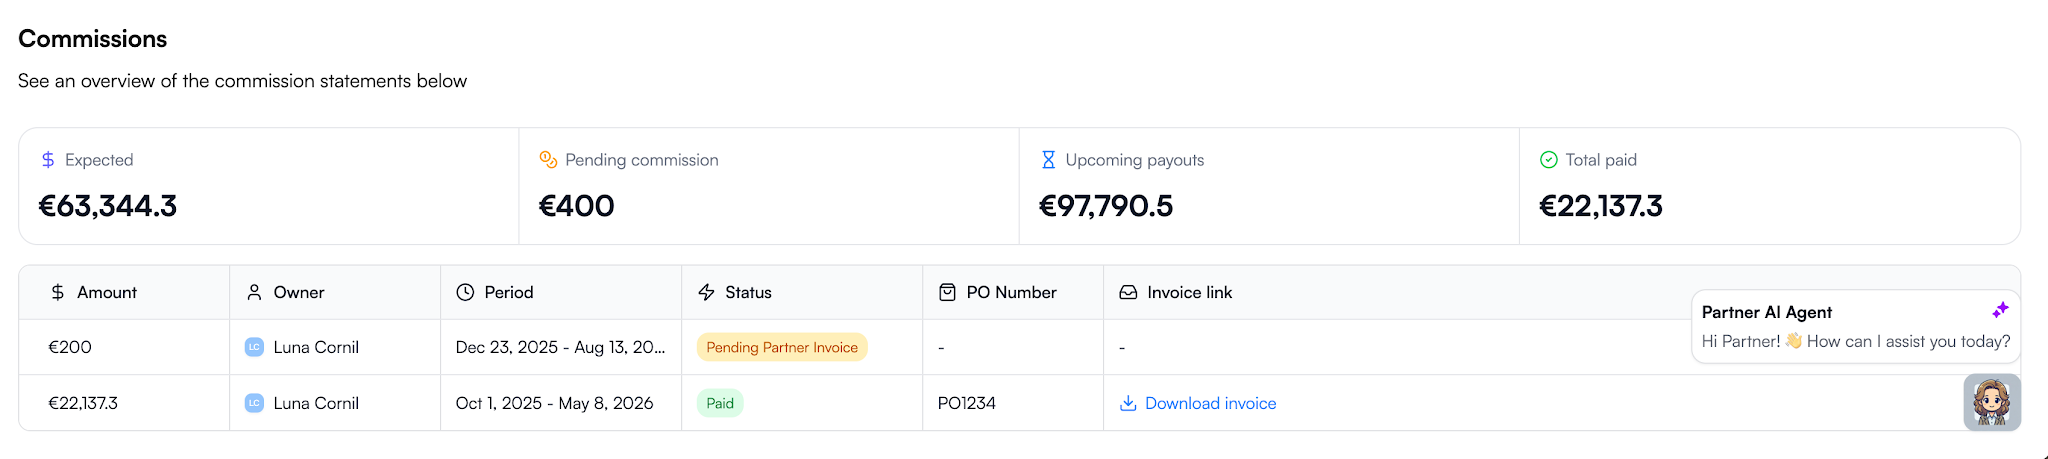
#10 Partner-sourced vs. partner-influenced revenue
These metrics prevent undercounting your channel’s contribution. Track both:
- Partner-sourced revenue: deals the partner originated and registered.
- Partner-influenced revenue: deals where the partner contributed but didn’t originate.
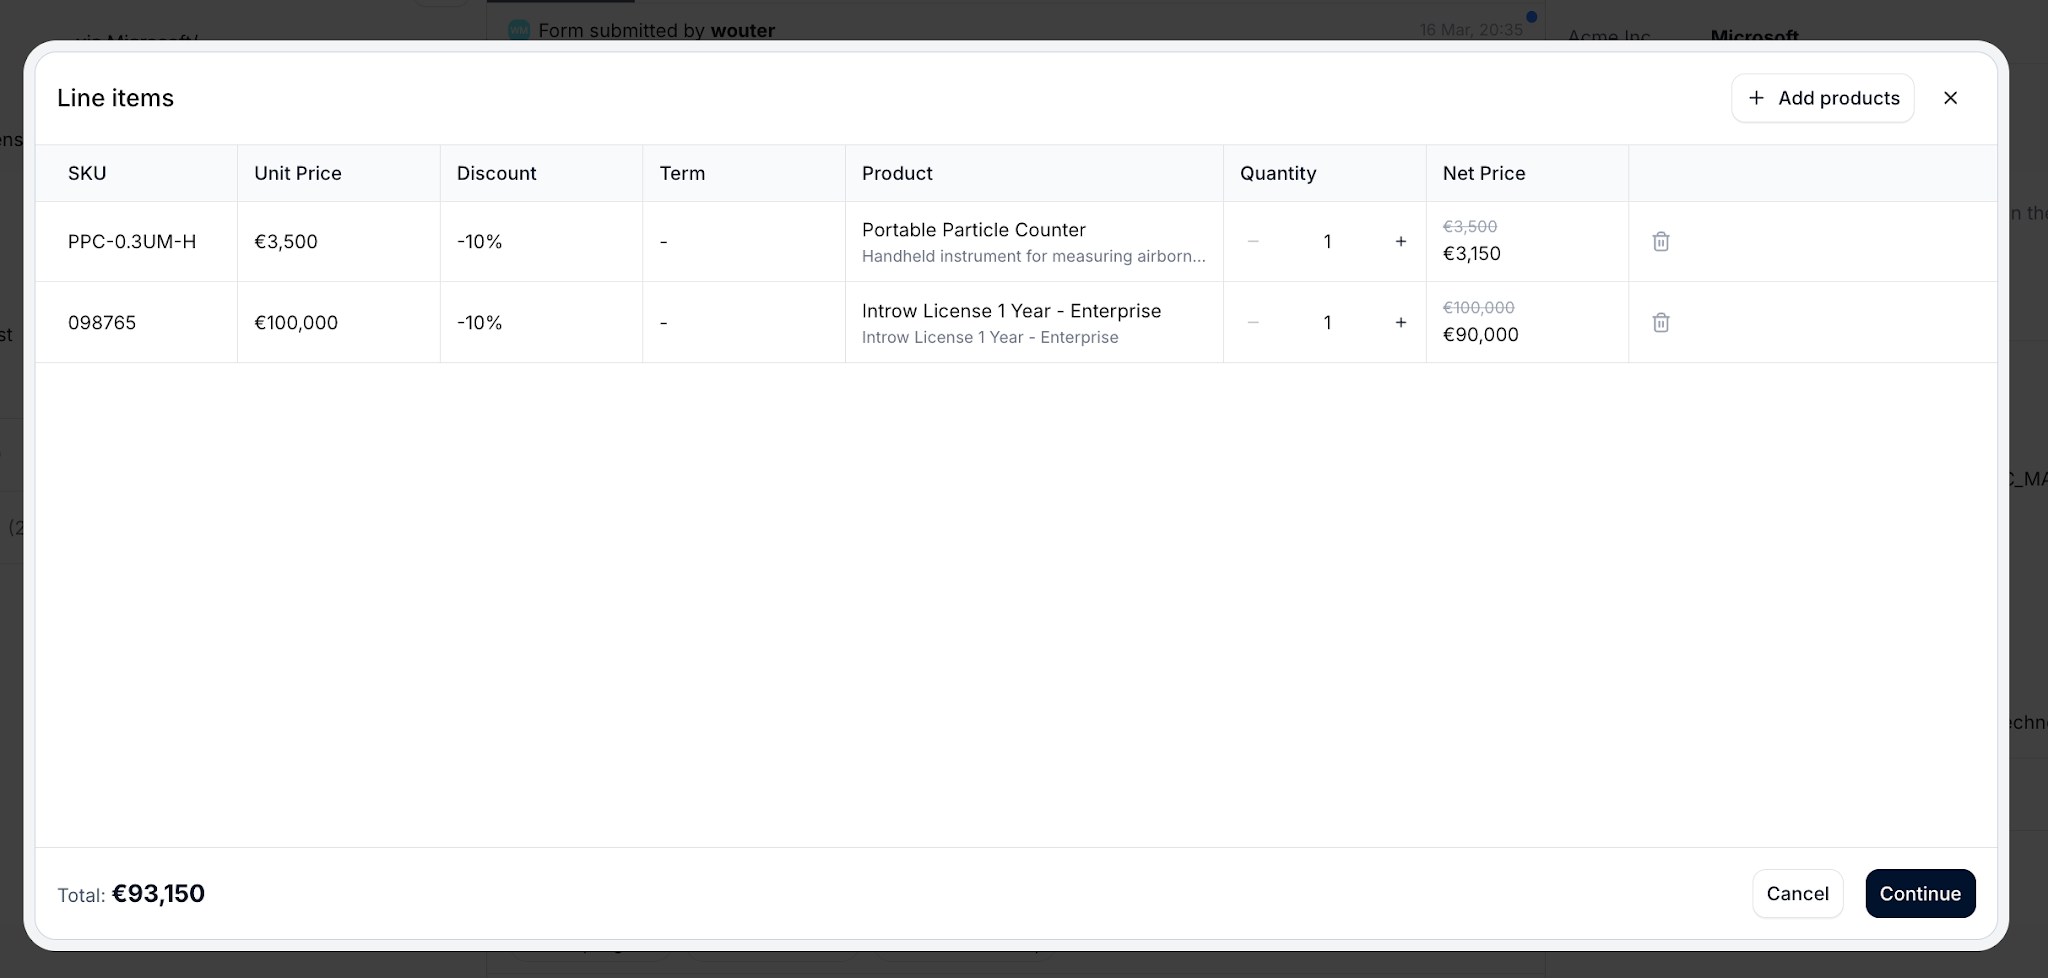
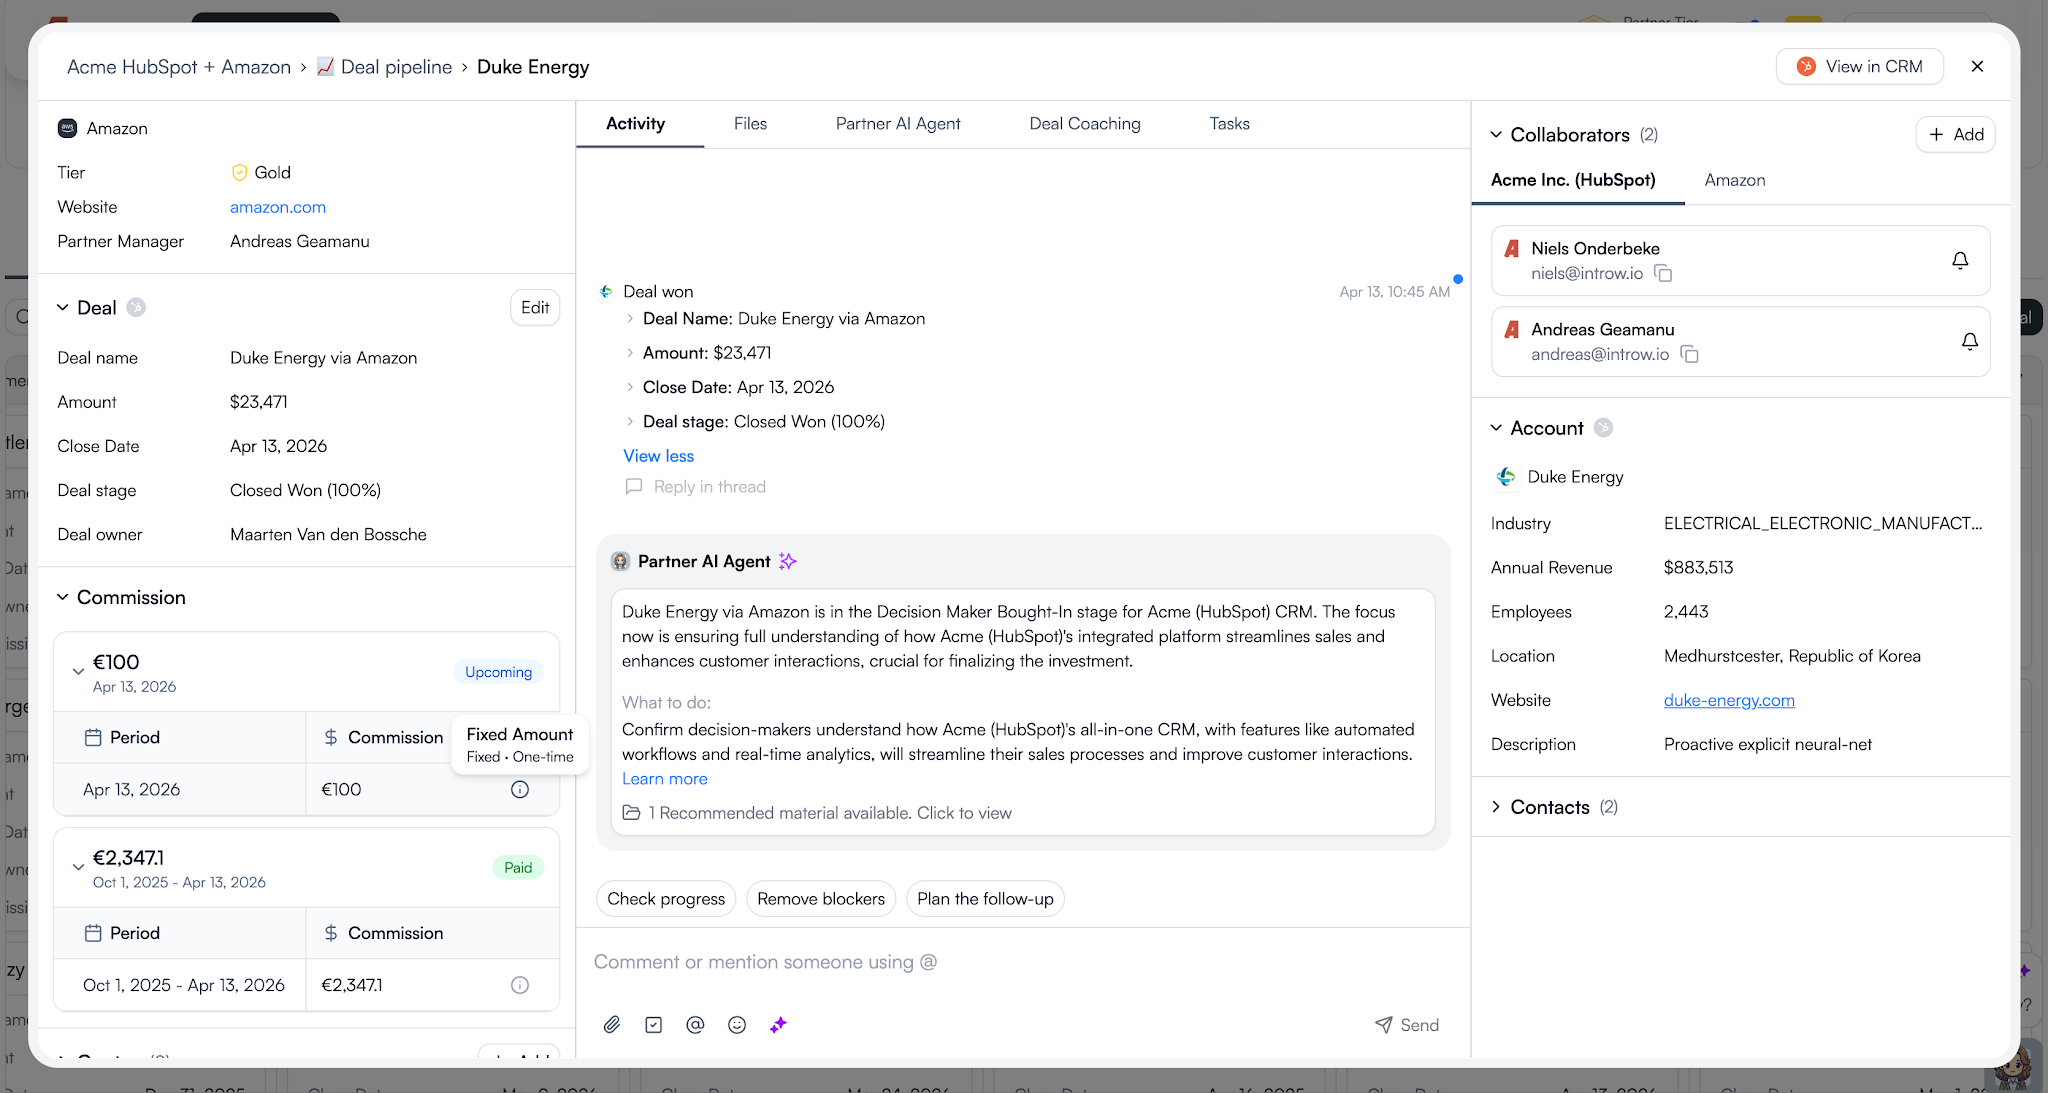
Pro tip: In Introw, you can set up separate attribution tracking for partner-influenced vs. partner-sourced revenue and make both metrics visible in your dashboards. This gives you accurate insight into your channel's full contribution without manual tracking.
#11 Average deal size by partner tier
Comparing average deal size across tiers helps you validate whether advanced training and program benefits are translating into bigger outcomes. If top-tier partners consistently close larger deals, it’s a strong signal your enablement path is aligned with real revenue leverage.
Partner satisfaction and retention metrics
Training metrics don’t just predict sales outcomes — they predict relationship outcomes. Partners who feel supported stay engaged longer, and longer-tenured partners are typically more productive.
#12 Partner Net Promoter Score (NPS)
Partner NPS measures how likely partners are to recommend your program. Collect it via lightweight surveys at key moments (post-onboarding, post-first-deal, quarterly). A strong NPS usually means partners understand your value proposition and feel the program is worth prioritizing.
#13 Partner churn rate
Partner churn rate tracks the percentage of partners who leave your program over a given period. High churn often points to poor enablement, lack of support, or better opportunities elsewhere in their partner lifecycle.
#14 Program renewal rate
Renewal rate measures how many partners re-commit at the end of a contract or tier period. Declining renewal is often an early warning that your program benefits (including enablement) aren’t translating into partner ROI.
How to track partner enablement metrics in your CRM
If you want reliable attribution, you need one system of record. For most companies, that’s the CRM. When enablement data lives in a disconnected LMS or portal, you can’t confidently answer the question: “Did training change outcomes?”

Required fields on partner and deal records
To operationalize the partner enablement training metrics to track, add (or standardize) fields like:
- Certification status: current certification level and expiration date.
- Training completion date: when onboarding was completed (or last updated).
- Partner tier: ties training requirements to expected performance.
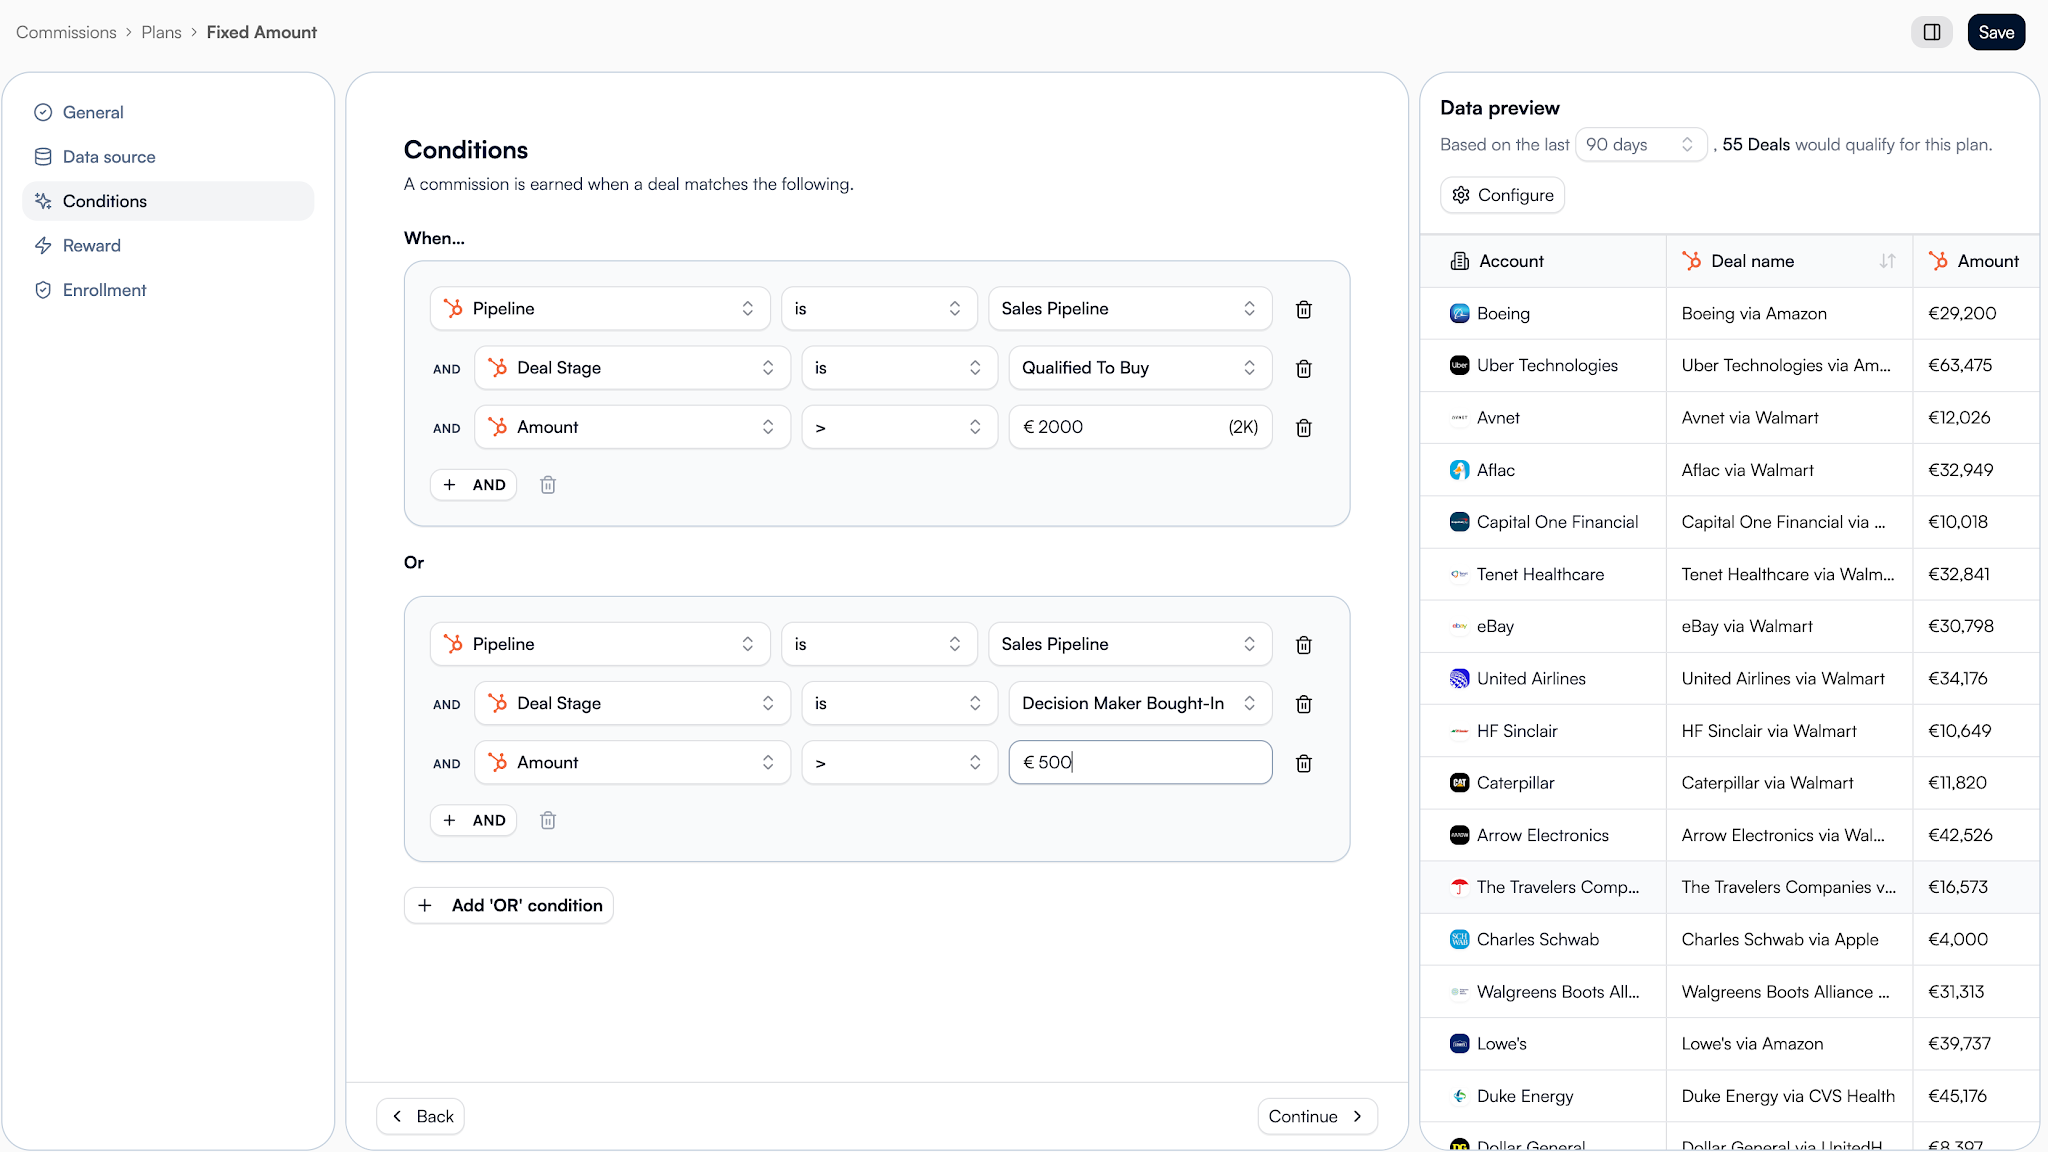
- Deal source: partner-sourced vs. partner-influenced (critical for attribution).
Dashboards and reports to build
- Enablement coverage: certification status by partner, tier, and region.
- Outcome comparison: pipeline, win rate, and revenue for certified vs. non-certified partners.
- Velocity view: time-to-certification and time-to-first-deal trends over time.
Build dashboards that drive action. If a report can’t lead to a specific next step (coach, nudge, change the curriculum, adjust tier requirements), it’s likely noise.
Automations for real-time visibility
Automations turn reporting into operations. Examples:
- Alerts when certifications are expiring.
- Reminders when training is incomplete after X days.
- Flags when certified partners haven’t registered a deal in 60–90 days.
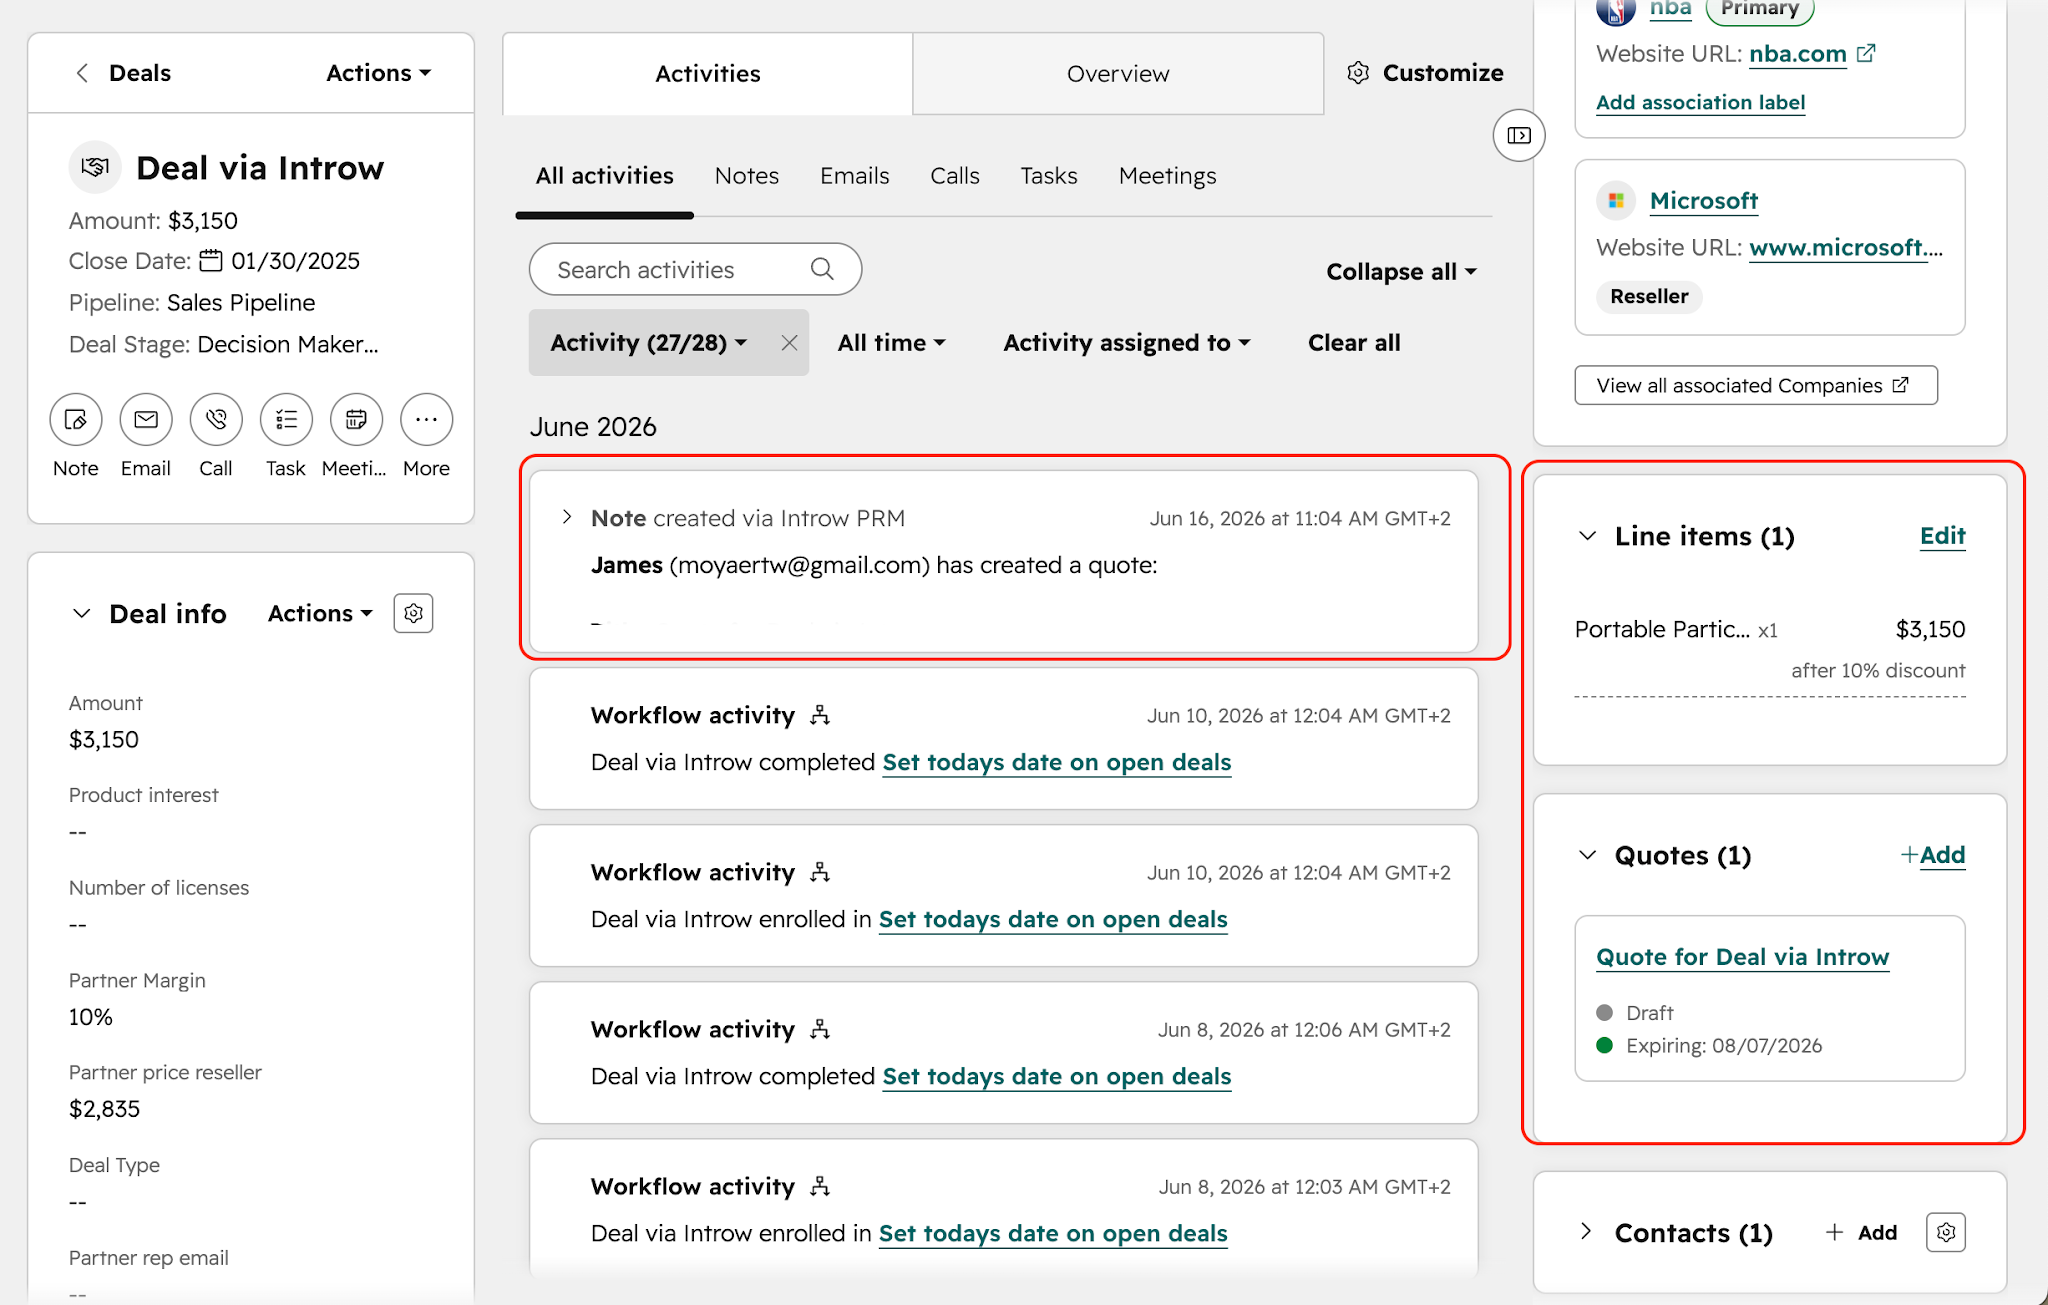
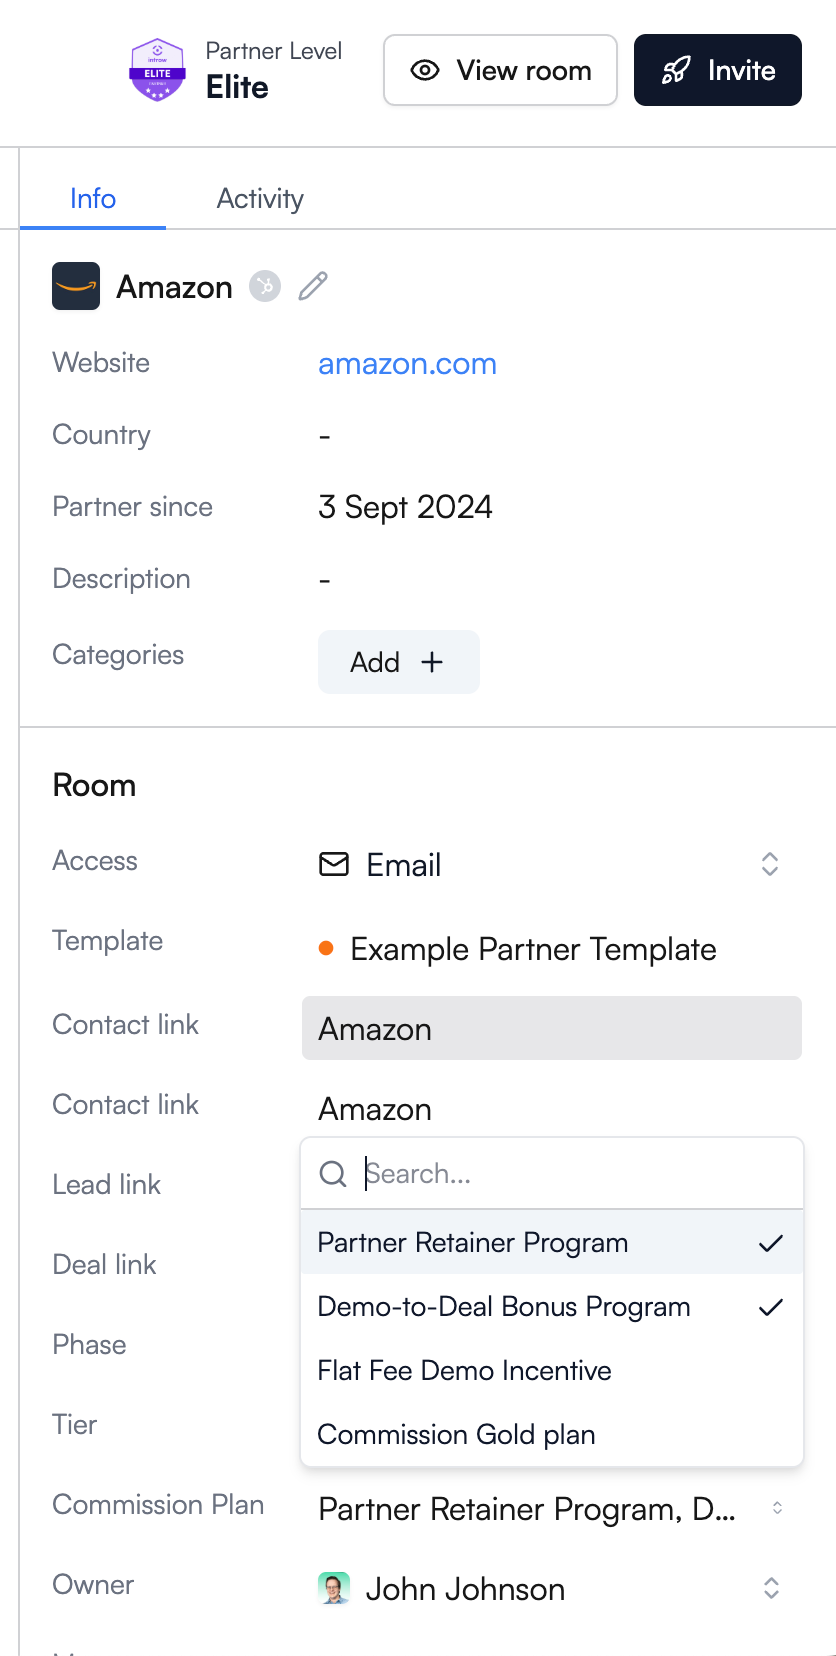
CRM-first tools like Introw can trigger automations inside HubSpot or Salesforce — keeping enablement data visible where your team already works.
Why measuring partner training ROI is difficult (and how to avoid common traps)
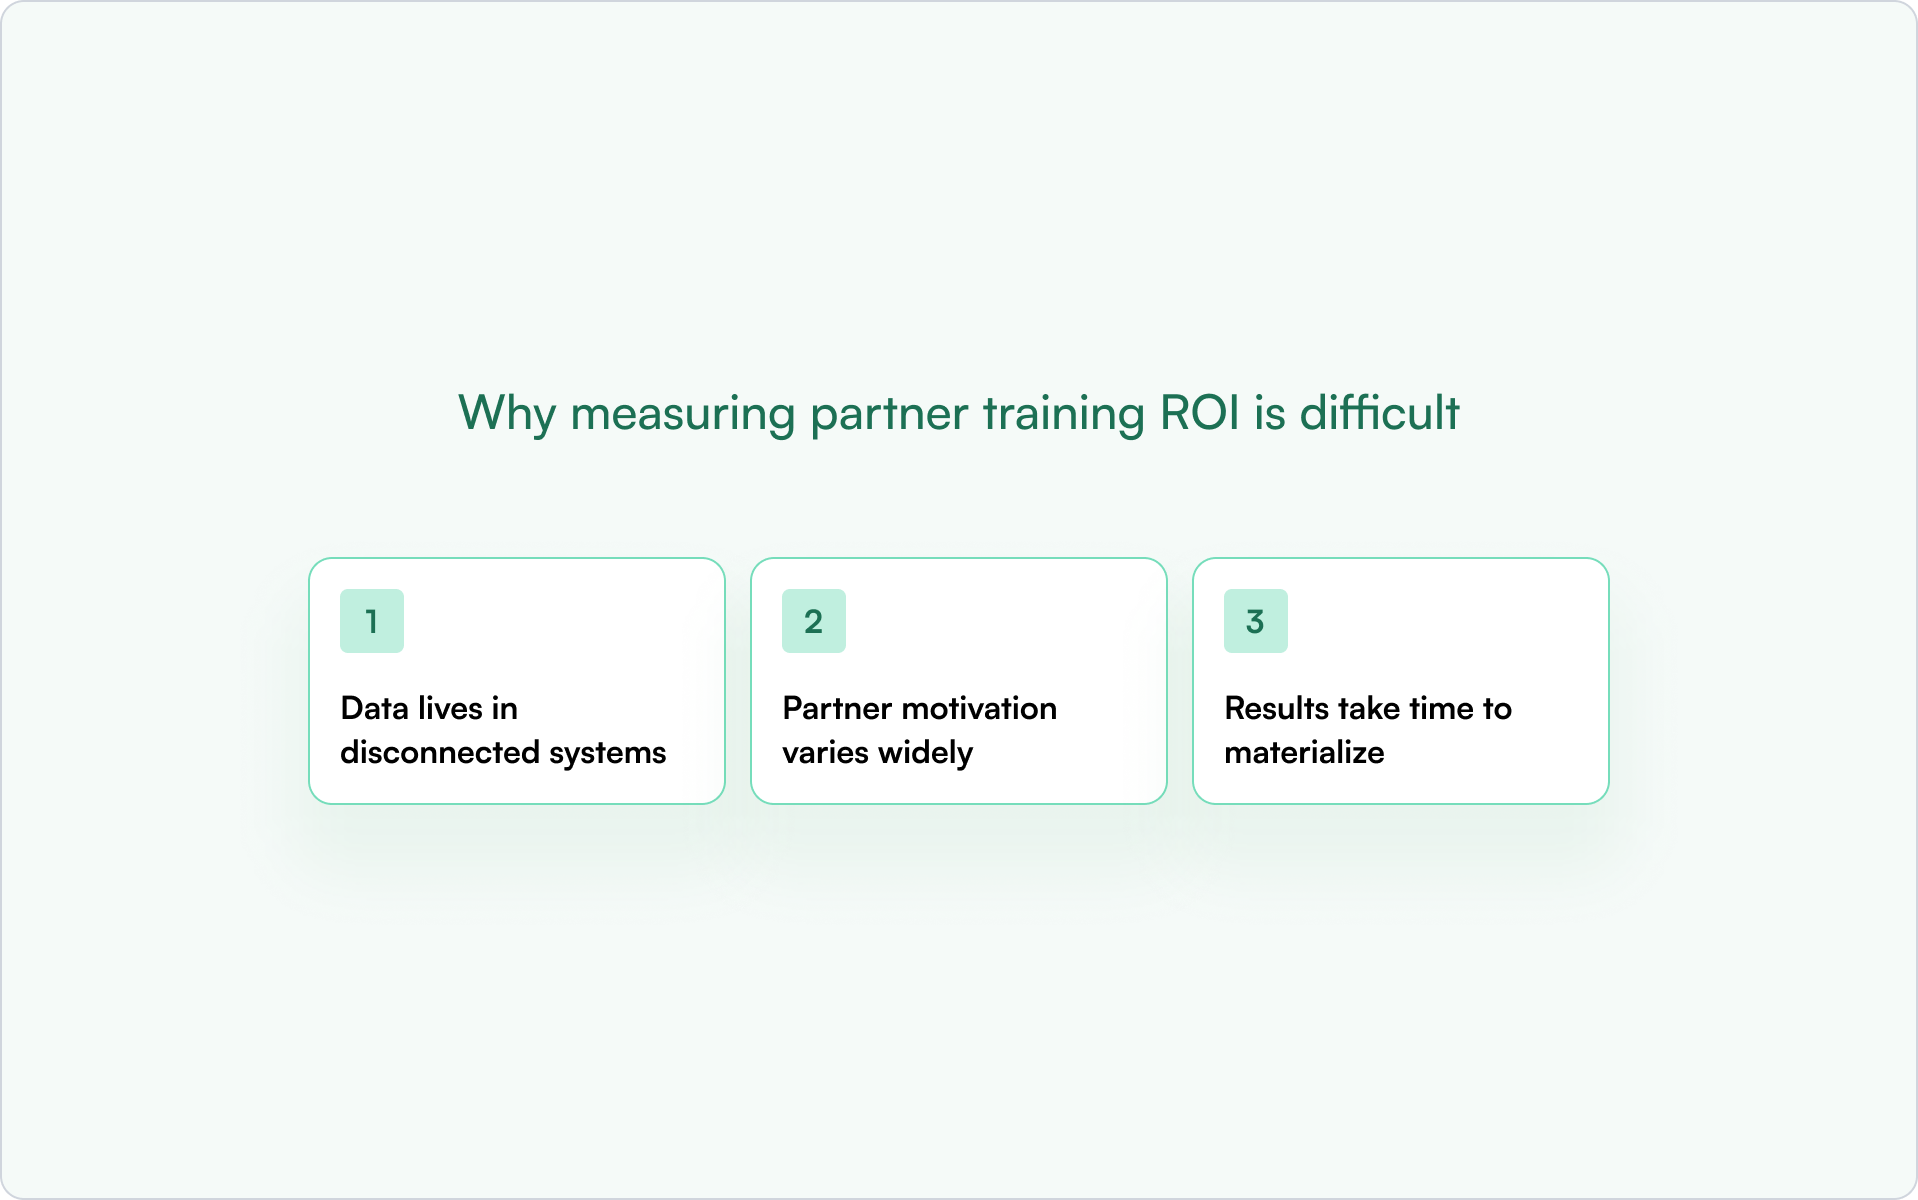
Data lives in disconnected systems
LMS data, CRM data, and partner portal data often don’t sync. That breaks attribution because you can’t connect the training path to the opportunity record without manual work. CRM-first PRMs reduce this problem by keeping the key partner activity signals close to the revenue data.
Partner motivation varies widely
Partners have competing priorities. Even great training gets ignored if it feels generic, if it’s too long, or if certification doesn’t unlock real benefits. If you see high enrollment but low completion, motivation and incentives are usually the root cause — not content quality alone.
Results take time to materialize
The revenue lag is real. A partner who completes certification in Q1 might not close their first deal until Q3. This is exactly why you need a balanced dashboard: leading indicators tell you whether you’re building future performance while lagging indicators validate the payoff.
Who should see partner enablement reports (and what each team needs)
A single “master dashboard” rarely works. Different stakeholders need different slices of the truth — and different levels of detail.
- Partner managers: certification status, portal engagement, inactive-certified partner lists (coaching and outreach).
- RevOps: data quality, attribution rules, pipeline hygiene, and forecasting impact.
- CROs and revenue leaders: partner-sourced revenue, influenced revenue, deal velocity, and ROI by program.
Conclusion: turn partner enablement into a measurable growth engine
If you’re serious about scale, partner enablement can’t be measured by “who completed training.” It has to be measured by what changed: faster ramp, more pipeline, better win rates, larger deal sizes, and longer partner retention.
The good news is that you don’t need dozens of metrics. You need the right partner enablement training metrics to track, tracked consistently, and connected to CRM outcomes so the story is obvious to anyone reading the dashboard.
Turn partner enablement data into revenue with Introw
Tracking enablement metrics in spreadsheets or disconnected systems creates blind spots. Introw’s CRM-first PRM keeps enablement data inside HubSpot or Salesforce — giving you real-time visibility without manual exports or reconciliation.
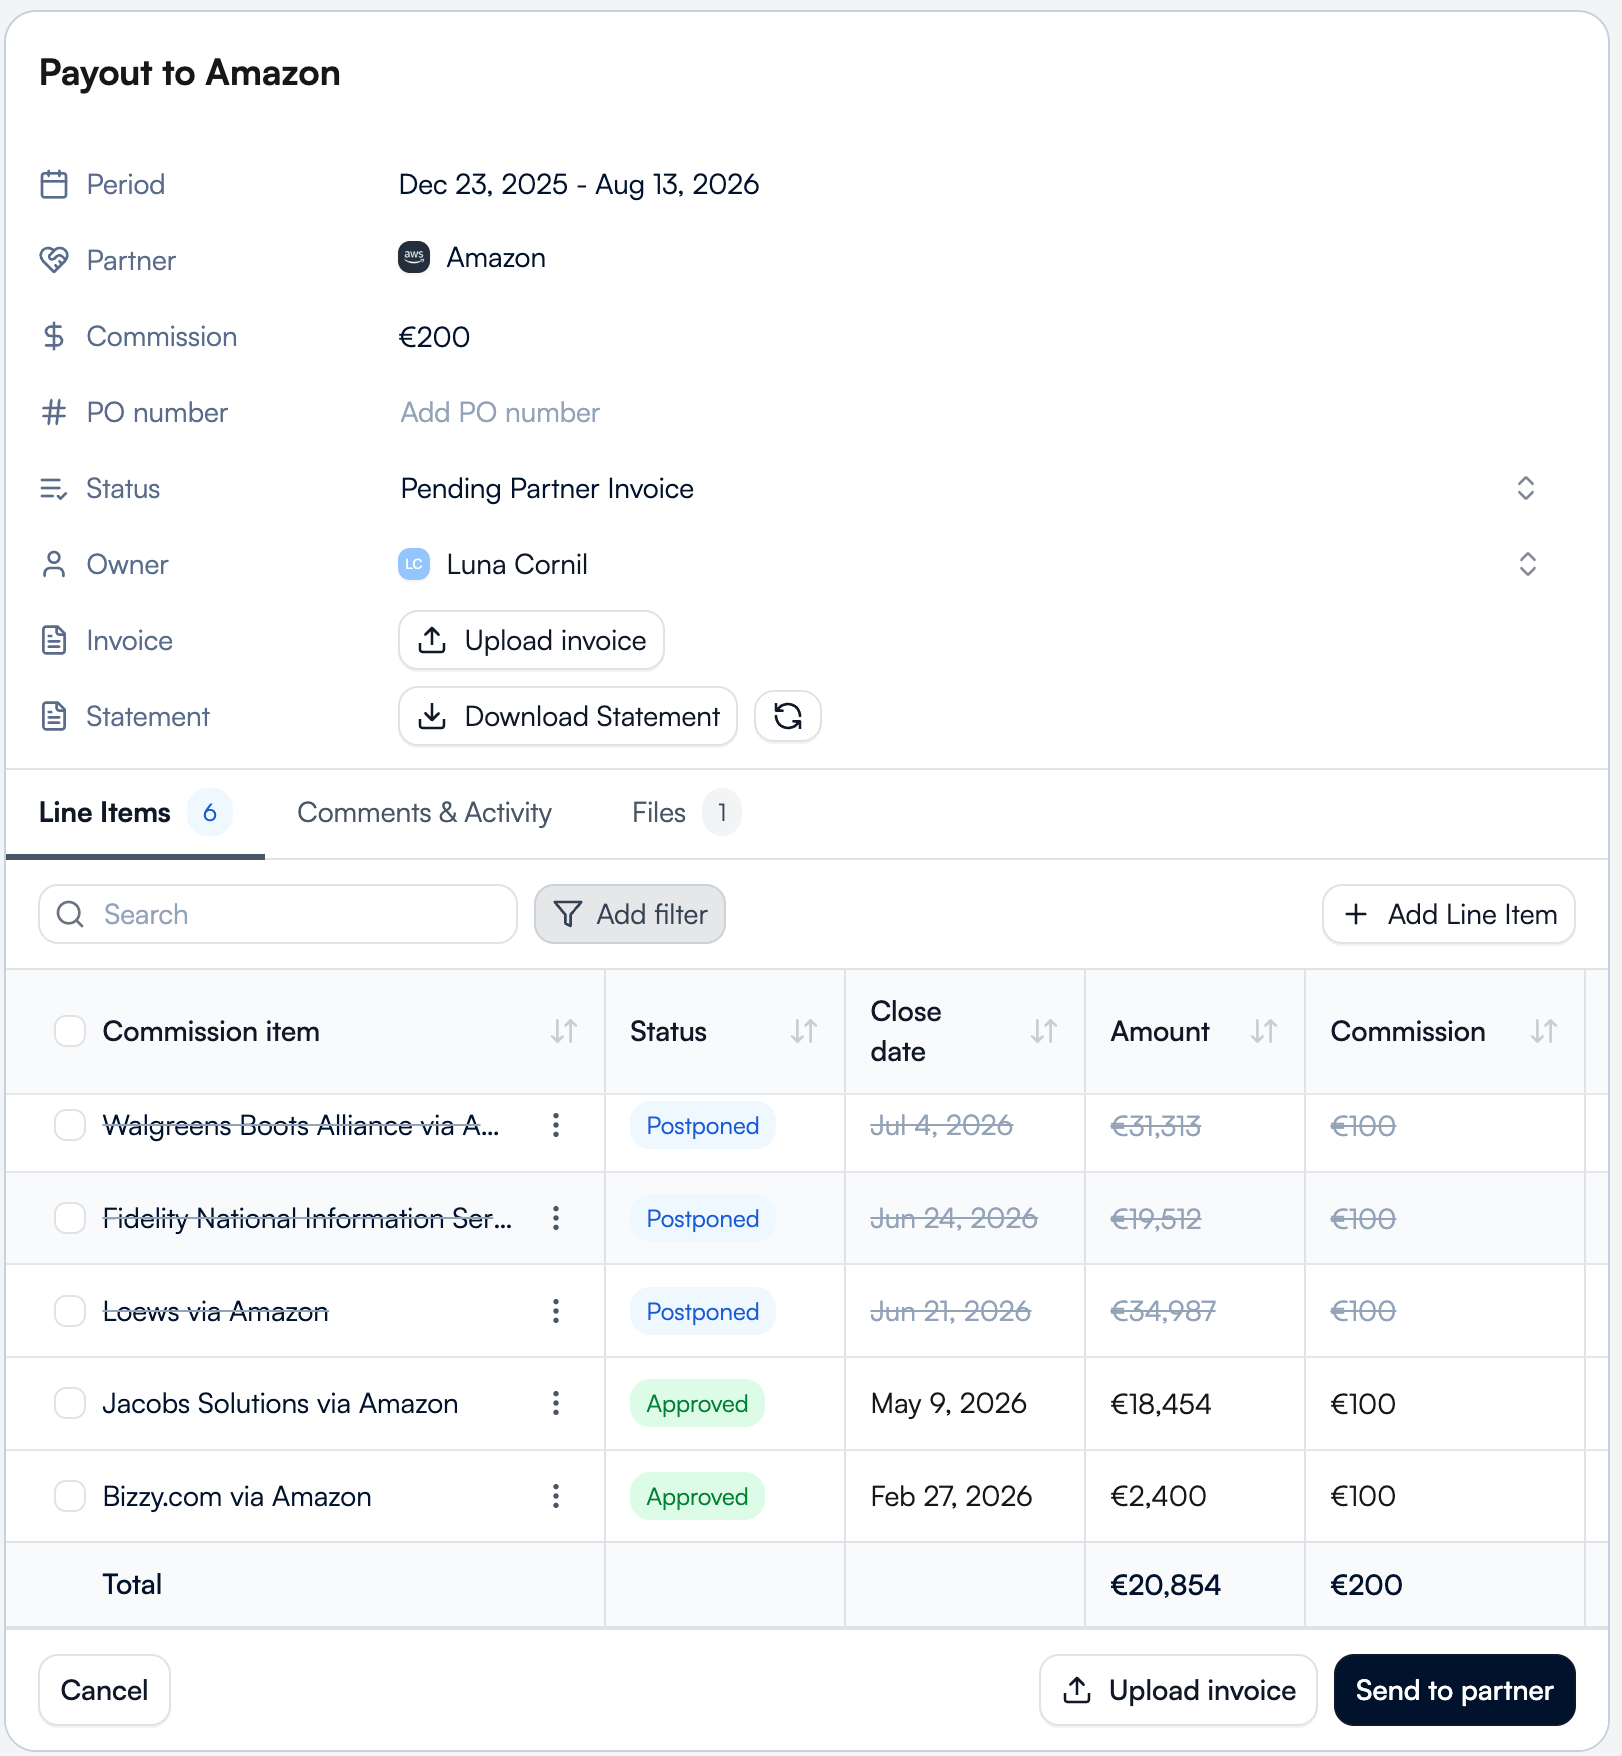
Deal registration, partner portal activity, and announcement engagement all sync back to your CRM automatically. That means you can report on certification status, time-to-first-deal, and partner-sourced revenue without chasing data across systems.
If you want to see how this works in practice, you can request a demo and walk through how Introw tracks partner enablement metrics automatically.
What are the most important partner enablement training metrics to track?
Start with a tight set that connects training to outcomes: training completion rate, certification pass rate, time to certification, deal registrations per certified partner, time-to-first-deal, and partner-sourced vs. partner-influenced revenue. These give you a balanced view — engagement, readiness, and impact.
How often should channel leaders review partner enablement metrics?
Review leading indicators weekly (logins, training progress, content engagement) so you can intervene quickly. Review pipeline and revenue monthly. Review retention and satisfaction quarterly, since those signals move more slowly and reflect longer-term program health.
What is a “good” training completion rate for partner programs?
Benchmarks vary widely by partner type and curriculum length. Instead of chasing an arbitrary number, track completion by cohort (e.g., partners recruited in the same month) and aim for consistent improvement. If you change onboarding, completion rate should move — and you should see corresponding movement in time-to-first-deal over time.
How do you attribute revenue to training or certification?
The practical approach is comparison: tag partners (and ideally deals) with certification status and completion dates, then measure differences in pipeline created, win rate, average deal size, and revenue between certified and non-certified groups. The delta is your ROI signal. The cleaner your CRM data model, the more credible this becomes.
Should partner managers track different metrics for different partner types?
Yes. Resellers, referral partners, and implementation partners have different motions and incentives. A referral partner program may focus on lead volume and acceptance rate, while an SI program may care more about certification depth, implementation quality, and customer outcomes. The goal is the same — enablement tied to impact — but the “impact” differs.


.png)
.png)
.png)
.png)
.png)
.png)
.png)
.png)
.png)

.png)
.png)


.png)
.png)
.png)
.png)
.png)
.png)
.png)
.png)
.png)
.png)
.png)
.png)
.png)
.png)
.png)
.png)
.png)
.png)